General
House Profit Calculator Guide for Flips and Rentals
September 26, 2026
18 min read
You're at the kitchen table with a purchase contract in one hand and a phone calculator in the other. The deal looks profitable until you change the resale price, add a financing charge, or extend the renovation timeline. Then you run the numbers again, and the margin moves.
That's the problem with treating a house profit calculator as a single sale-price-minus-purchase-price formula. A usable underwriting sheet has to model the acquisition, repairs, financing, holding period, taxes, selling costs, and the quality of the resale estimate. It should show both the gross spread and the money that remains after the costs that reach your bank account.
Why a House Profit Calculator Matters in 2026
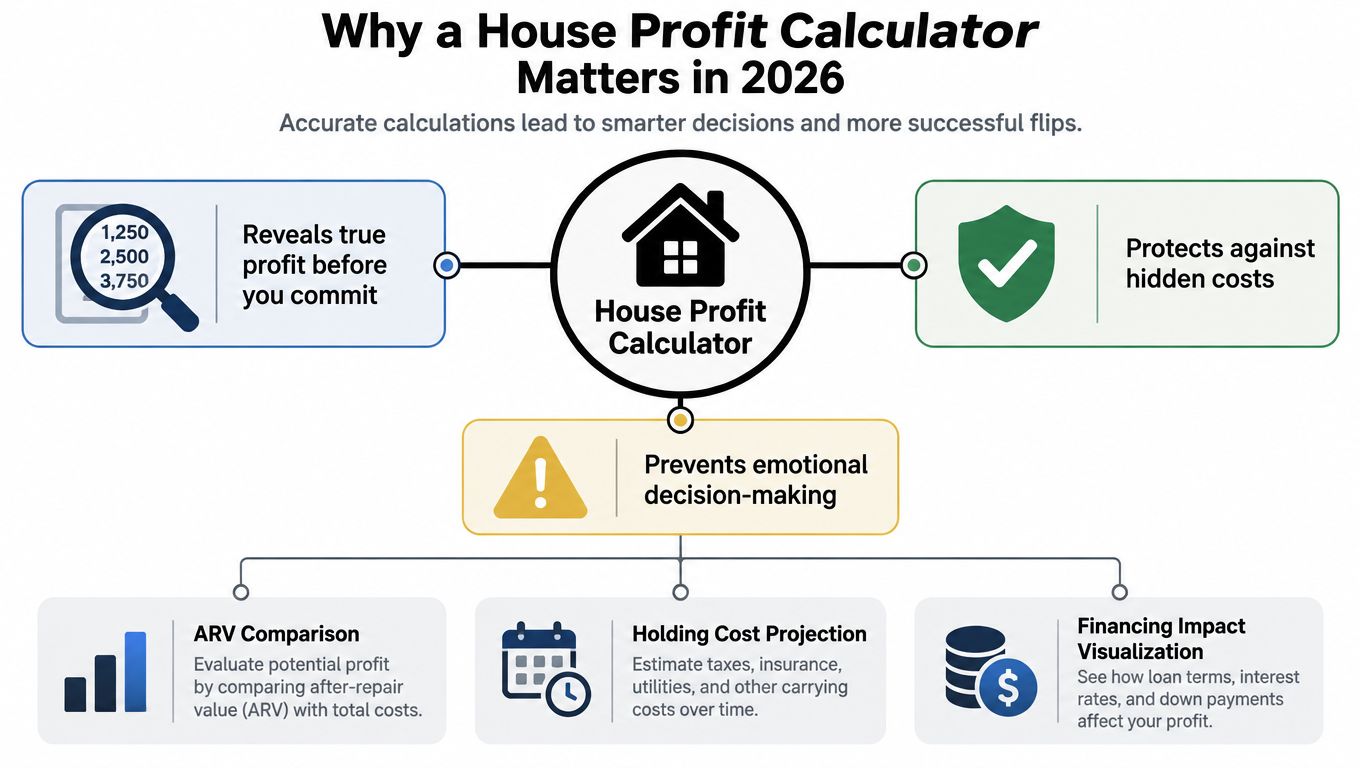
A flip can look attractive on the first pass because the purchase price and projected resale value create a wide headline spread. The margin often disappears later through loan interest, insurance, utilities, taxes, contractor changes, staging, concessions, and a longer listing period. Those costs don't improve the property, but you still pay them while you own it.
The national backdrop makes that discipline more important. ATTOM's 2025 U.S. Home Flipping Report found that the typical flipped home produced a $65,981 gross profit and a 25.5% return on investment, the lowest recorded rate since 2008. In 2012, the typical flip produced a 61.1% return on investment, showing how sharply the output can change with market conditions, purchase price, repair spending, and resale timing.
Gross profit isn't the number you take home
Suppose your calculator shows a $60,000 difference between your projected sale price and the purchase, renovation, and basic transaction costs. That may be gross profit. Net profit comes after the interest charged on the loan, the cash tied up during the project, taxes, and any costs caused by delays.
The difference matters because financing and time can turn a seemingly strong return into a thin one. A deal that works on a static spreadsheet may fail when the contractor misses the schedule or the buyer asks for a concession. Your calculator needs a timeline, not just a column of dollar amounts.
Practical rule: If the model doesn't show your monthly burn rate and a downside resale value, it isn't underwriting the deal. It's describing the deal you hope to get.
The volume data also argues against using a permanently optimistic baseline. ATTOM and HousingWire coverage of 2024 flipping activity reports 297,885 single-family and condominium flips in 2024, down 7.7% from 2023 and 32.4% below the 2022 peak of nearly 441,000 flips. The share of flips among all home sales fell from 8.1% to 7.6%. Fewer transactions and narrower margins mean small errors in ARV, repairs, or timing carry more weight.
A serious calculator should answer three questions before you make an offer:
- What is the property worth after the work, based on credible sold comps?
- What will the project cost after debt, holding, selling, and tax expenses?
- What happens if the resale value falls, repairs rise, or the project takes longer?
Tools such as AI for real estate investment analysis can help organize the research, but the investor still has to challenge the inputs. Automation can speed up comp selection and reporting. It can't make a weak comp set or an unrealistic timeline reliable.
The Core Formulas Behind Every House Profit Calculator
A house profit calculator should function as an underwriting sheet, not a single subtraction. Start with the resale value, then work backward through acquisition, renovation, financing, holding, disposition, taxes, and the profit you require.
ARV comes before the offer
After Repair Value, or ARV, is the resale price you can defend once the planned work is complete. It should come from roughly 3 to 5 closed comps, adjusted for square footage, condition, features, lot utility, and market movement. Active listings and seller opinions can provide context, but they do not establish the exit value.
The valuation methodology for adjusted and weighted comps recommends correcting each comparable before reconciling the indications. Give more influence to recent, physically similar, arm's-length sales that require fewer adjustments. Normalize the weights so they add to 1.0, then calculate:
Weighted ARV = Adjusted Comp 1 × Weight 1 + Adjusted Comp 2 × Weight 2 + ...
Before treating that resale estimate as settled, investors can find out if a property is a suitable investment through broader property analysis. The calculator is only as reliable as the comp set behind it.
MAO is a starting point, not a verdict
The familiar maximum allowable offer formula is:
MAO = (ARV × target percentage) − repair cost
The target percentage must cover more than the renovation. It needs to leave room for selling costs, financing, holding time, risk, and your required net margin. A calculator that subtracts repairs alone can make an offer look safe while hiding a weak net return.
Build repairs from the property, not a guess
Separate the renovation budget into recognizable categories:
- Structural: Foundation, framing, drainage, and major exterior defects.
- Systems: Roof, electrical, plumbing, HVAC, sewer, and water-related work.
- Cosmetic: Kitchens, bathrooms, flooring, paint, fixtures, and trim.
- Site work: Landscaping, grading, fencing, driveways, and exterior cleanup.
- Contingency: A percentage of the repair budget reserved for unknown conditions.
Use a contractor's bid to support the estimate, then keep a contingency line. A detailed bid does not protect the budget from hidden damage, code requirements, or scope changes.
Carrying costs accumulate while nothing changes
Monthly holding costs generally include property taxes, insurance, utilities, HOA charges, security, and routine maintenance. Multiply the monthly total by the expected hold period, then add financing costs. Test a longer timeline as well, because an extra month can reduce a thin margin quickly.
The basic daily financing formula is:
Daily financing cost = loan balance × (interest rate ÷ 365)
For a draw-based loan, calculate interest on the outstanding balance as draws occur. For a loan funded upfront, apply the applicable balance from the start. Use this holding-cost calculation guide to separate recurring property expenses from debt charges.
Closing costs belong on both sides
Acquisition closing costs can include title work, recording, inspections, transfer taxes, and lender charges. A practical model can test 1% to 3% of the purchase price for the acquisition side.
Disposition costs should be modeled separately as a percentage of the sale price. For a flip, a planning range of 6% to 10% can cover commissions, seller-side closing costs, staging, marketing, concessions, and other exit expenses. The exact figure depends on the market and sales plan, so stress-test it rather than treating the low end as guaranteed.
The master equation is:
Net Profit = ARV − acquisition price − repair cost − holding costs − financing costs − closing costs − taxes
Keep gross profit and net profit on separate lines. Gross profit shows the spread before project friction. Net profit shows what remains after the capital, time, debt, and tax burden are included. That is the figure an investor should use when deciding whether the deal earns its place in the pipeline.
Choosing the Right MAO and ARV Approach
The 70% rule is useful because it forces a discount between the projected resale value and the price you pay. It isn't enough because the discount has to cover more than repairs. In a slower sale or a debt-heavy project, it also has to cover the cost of waiting.
The 80% rule is more aggressive:
MAO = ARV × 0.80 − repairs
That can make sense for a light renovation with strong demand, limited debt, and a dependable exit. It becomes dangerous when interest rates rise, buyer demand weakens, or the property sits longer than expected.
A weighted-comps approach starts with a comp-adjusted ARV, then subtracts every known project cost and the net margin you require. It takes more work, but it ties the offer to the property and the financing plan rather than a universal shortcut.
Using an ARV of $300,000 and repairs of $50,000, the three entry points look like this:
| Approach | Formula | MAO | Estimated Net Margin |
|---|---|---|---|
| 70% Rule | $300,000 × 0.70 − $50,000 | $160,000 | Larger initial cushion, but not a calculated net margin |
| 80% Rule | $300,000 × 0.80 − $50,000 | $190,000 | Thinner cushion before financing, holding, selling, and tax costs |
| Weighted Comps | Comp-adjusted ARV minus repairs and target project margin | Roughly $175,000 | Depends on the underwritten costs and required net profit |
The arithmetic produces different offers, but the table doesn't prove that any offer works. The $175,000 weighted-comps example is only a decision point until you enter the actual financing, holding period, sales costs, and tax treatment.
Where each shortcut fails
The 70% rule can leave money on the table in a tight rental area or a soft market where the correct discount depends more on local liquidity and financing than on a fixed percentage. The 80% rule can destroy the margin when the resale period stretches. Weighted comps fail when investors use active listings, stale sales, or properties that need major adjustments.
High-quality ARV work usually relies on 3 to 6 sold comps, with sold properties receiving the strongest influence. One ARV methodology reference recommends sold comps at 80% to 100% weighting, pending listings at 50% to 75%, and active listings at 0% to 20%. The same reference describes higher confidence when 5 or more comps are within 90 days and 0.5 miles, with a price-per-square-foot range within 8%. When evidence is weak, it suggests an underwrite discount of roughly 10% or rejecting the deal.
For practical comp selection, use a real estate sales comps workflow to inspect similarity rather than grabbing the highest number. Rules are sanity checks. The offer should come from a stress-tested ARV, complete costs, and the net margin you need.
Worked Examples for a Flip and a Rental Deal
The cleanest way to compare a flip and a rental is to put both on the same deal sheet. The exit strategy changes the financing, timing, and return calculation more than the physical renovation does.
Flip example
Assume a purchase price of $185,000, repairs of $40,000, an ARV of $295,000, and a 6-month hold. The financing is hard money at 12%, with 2 points charged upfront. The following illustration uses the target figures supplied for the scenario. Exact lender treatment varies, especially when interest is charged on draws rather than the full balance.
| Line Item | Flip Deal ($) | Rental/BRRRR ($) | Notes |
|---|---|---|---|
| Purchase price | 185,000 | 160,000 | Contract price |
| Repairs | 40,000 | 35,000 | Planned renovation |
| ARV | 295,000 | 250,000 | Supported resale or refinance value |
| Hold or operating period | 6 months | Refinance after stabilization | Timeline drives carrying costs |
| Target net result | 24,000 before tax | 9.2% cash-on-cash return | Scenario targets, not universal outcomes |
A simplified flip sheet runs like this:
- Start with ARV: $295,000.
- Subtract acquisition: $295,000 − $185,000 = $110,000.
- Subtract repairs: $110,000 − $40,000 = $70,000 before financing, holding, and selling costs.
- Add purchase closing costs: Enter the actual title, recording, inspection, and lender charges.
- Add rehab funding costs: Apply the 12% interest rate to the outstanding loan balance and add 2 points to the financed amount or cash-funded balance, depending on the loan documents.
- Add six months of holding costs: Include taxes, insurance, utilities, HOA, maintenance, and any extension charges.
- Subtract sale closing costs: Apply the expected disposition-cost percentage to the $295,000 sale price.
- Subtract taxes: At a 25% effective tax rate, multiply the taxable net profit by 0.25.
- Target outcome: The scenario is designed to produce about $24,000 net profit before tax and roughly 14% ROI on cash invested, subject to the exact financing balance and closing-cost assumptions.
The important lesson is not the final number. It's the order. If you subtract only the purchase and repairs, you haven't calculated profit.
Rental and BRRRR example
Now use a $160,000 purchase, $35,000 in repairs, a $250,000 ARV, and $1,850 monthly rent. The property is refinanced at 75% loan-to-value, so the refinance debt is:
$250,000 × 0.75 = $187,500
That loan can return capital, but it doesn't automatically create cash flow. First calculate the stabilized operating income, then subtract debt service, taxes, insurance, management, maintenance, vacancy, reserves, and other operating costs. The post-refinance capital left in the deal is:
Total cash invested − refinance proceeds after loan fees and payoff
The scenario targets a 9.2% cash-on-cash return, but that figure depends on the actual annual cash flow divided by the remaining cash invested. Headline ROI changes again when you include principal paydown and appreciation. Those are separate return components and shouldn't be blended into operating cash flow.
The flip is dominated by sale timing and debt payoff. The rental is dominated by sustainable rent, operating expenses, refinance terms, and the capital that remains trapped in the property. In both cases, financing structure is the largest swing factor, and hold time is the next.
How Financing and Hold Time Change the Real Return
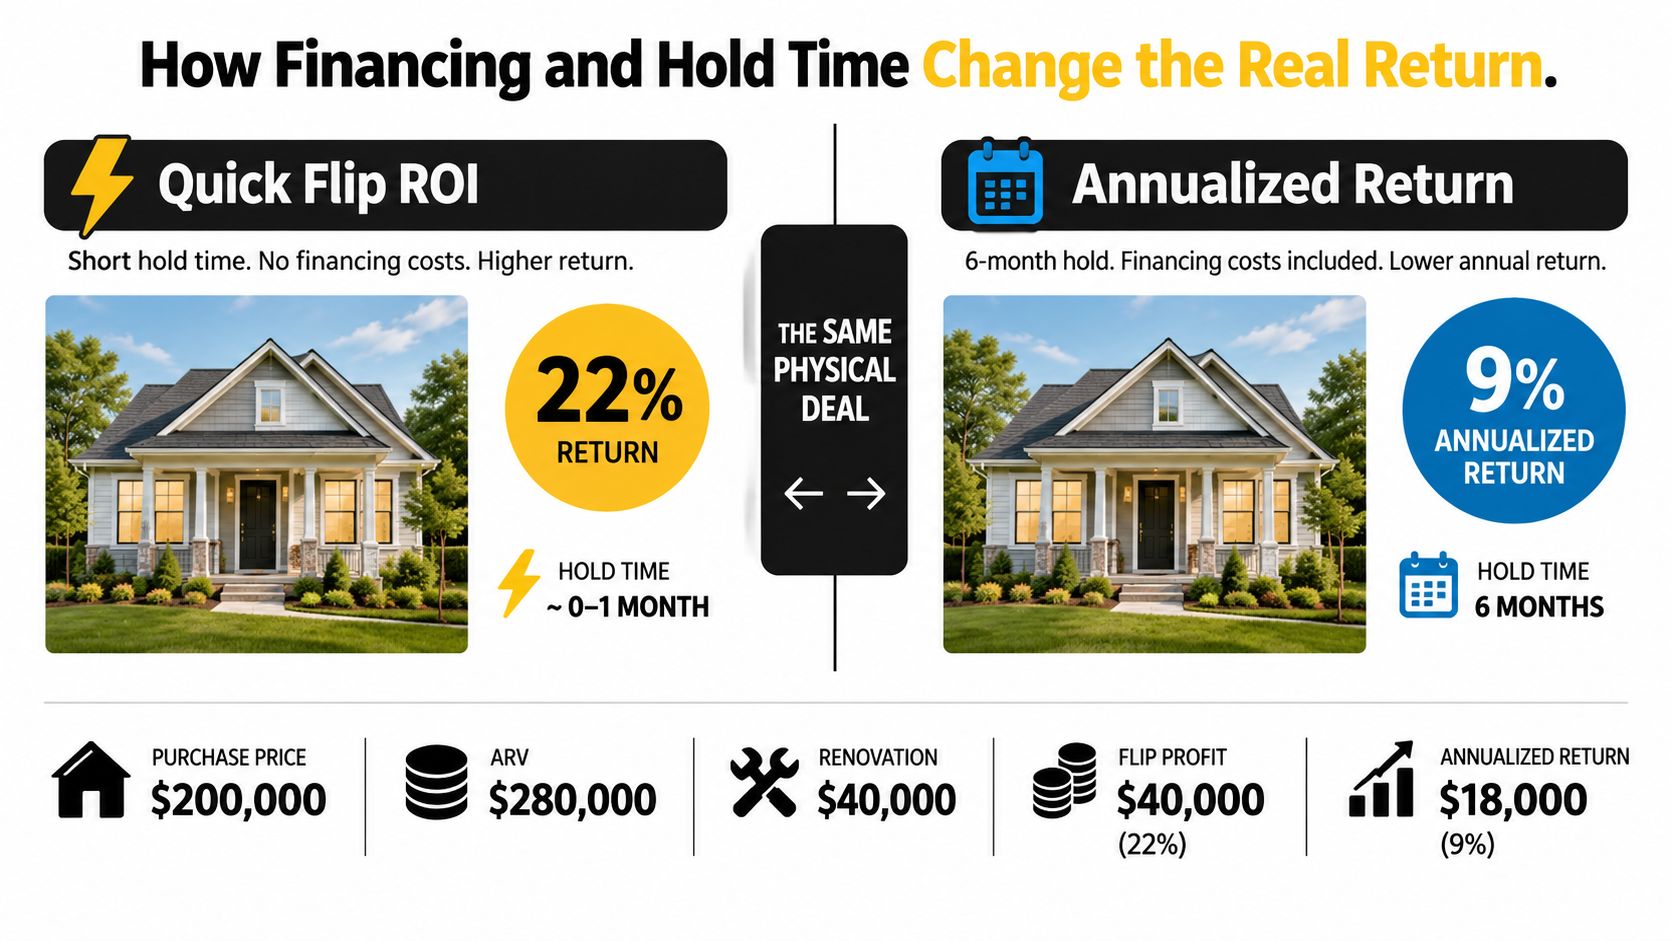
A single ROI percentage hides the calendar. The same property can show a strong quick-flip return and a much weaker annualized return once you account for the months your capital is committed and the interest charged during that period.
Hard-money financing guidance from Ent Credit Union notes that hard-money loans commonly run from 8% to 13%, and that extra holding days directly reduce profit. That cost should be entered as a daily accrual, not treated as a vague project expense.
Run financing cases on the same property
Use the flip example from the previous section and change only the funding structure:
- All cash: No loan interest or points, but more of your own capital is exposed.
- Conventional short-term loan: Potentially lower debt cost, with underwriting, appraisal, reserve, and qualification requirements.
- Hard money: Faster execution and renovation-oriented funding, but points, interest, draw rules, and extension costs can reduce the exit margin.
Don't assign a universal monthly cost to every deal. Calculate the loan balance, rate, draw schedule, property carrying costs, and extension terms. A delay adds interest and operating costs together. The supplied scenario uses a planning estimate of roughly $1,500 to $2,000 per extra month for loan interest, taxes, insurance, utilities, and possible extension fees, but your own balance and rate must replace that estimate.
A 60-day delay can erase a thin margin when the deal already relies on aggressive ARV or high borrowed funds. Add a break-even hold month to the calculator:
Break-even hold month = the month cumulative costs consume projected pre-tax profit
Taxes change the final answer
A quick resale may be taxed differently from a long-term investment gain. Dealer status, entity structure, and the use of a 1031 exchange can affect the after-tax result, but those decisions require advice from a qualified tax professional. Your calculator should show a pre-tax result and an after-tax scenario rather than pretending one tax line applies to every investor.
Stress-test at least two downside cases:
- ARV haircut: Reduce projected ARV by 10%.
- Repair overage: Increase repairs by 20%.
Then run both changes together and identify the month when the project reaches break-even. That view is more useful than a headline ROI because it tells you how much room remains when the plan stops going perfectly.
Common Calculator Mistakes That Eat Into Profit
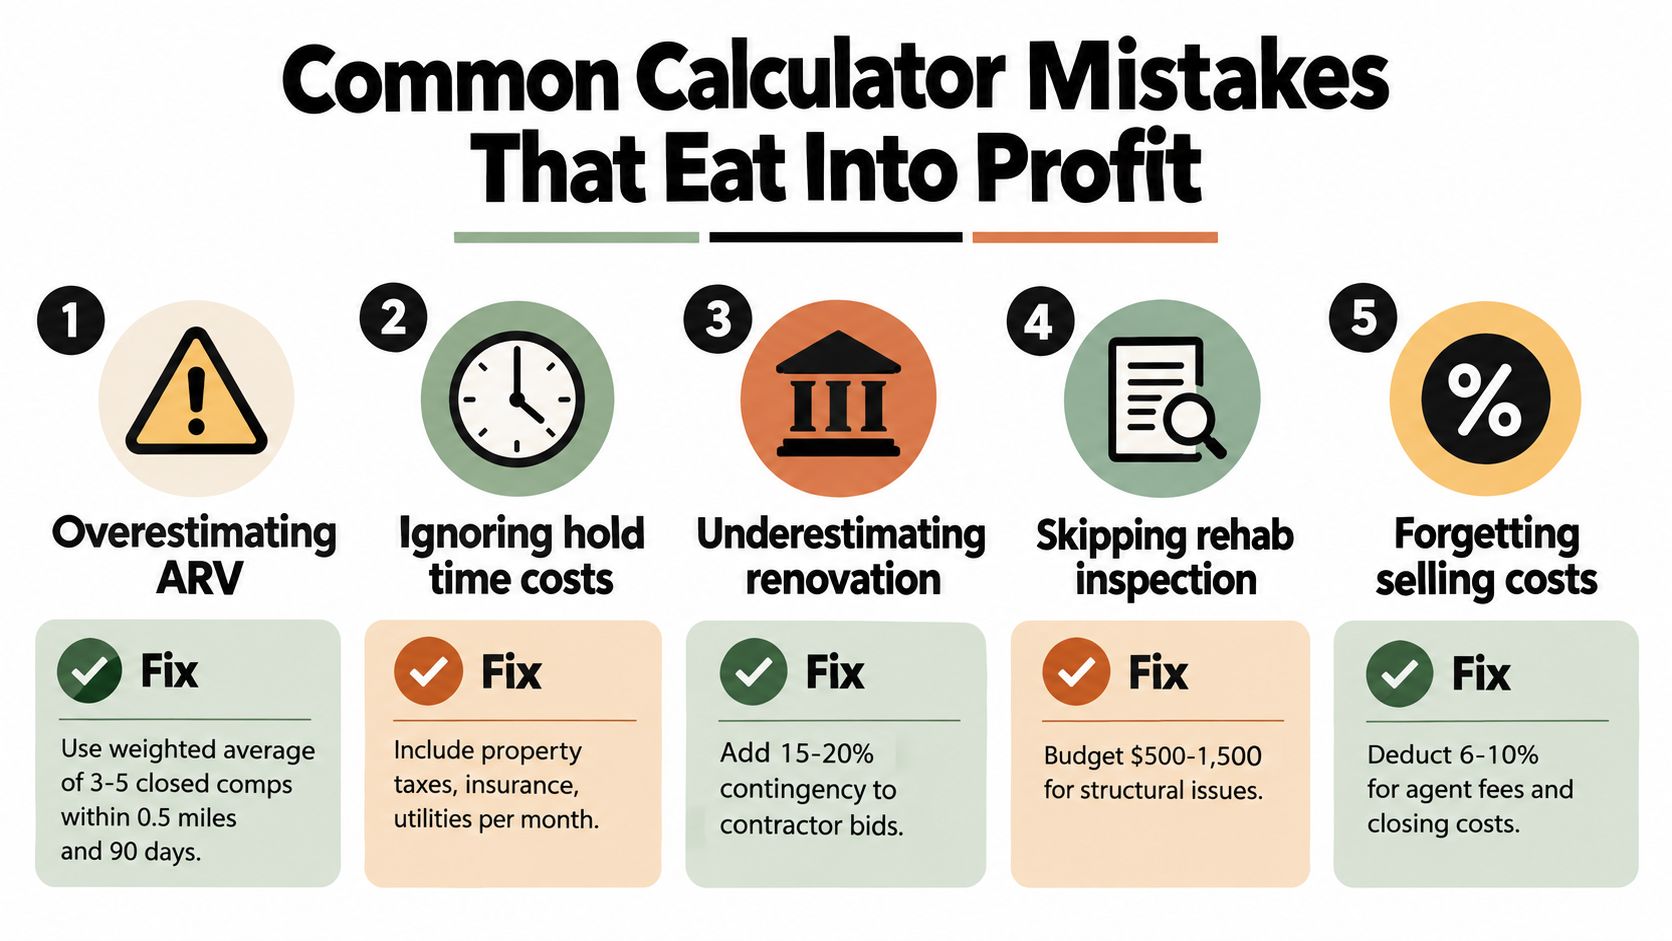
A deal sheet can show an attractive gross profit while hiding a weak net result. The problem usually starts with an assumption that looks reasonable on its own, then remains untested as financing, hold time, taxes, and exit costs accumulate.
Choosing the highest nearby sale for ARV is one common error. Give greater weight to closed sales than asking prices, and adjust for size, condition, features, lot utility, and sale timing. Use several relevant sold comps with explicit weights, then run a lower-value case when the evidence is limited. A headline ROI built on one optimistic comp is not an underwriting result.
A contractor's first budget is another frequent failure point. Keep structural and systems work visible, add a separate contingency line, and revise the estimate after inspections expose hidden conditions. If contingency is folded into one total, cost growth becomes difficult to track and easier to ignore.
Soft costs also need their own lines. Permits, title updates, staging, photography, inspections, loan origination, and legal work can each affect net profit. Group related items only when the category is defined clearly. Any cost you cannot locate in the sheet is a cost you may miss when it increases.
Rental assumptions require a different check. Entering projected rent alone measures potential revenue, not cash flow. Subtract vacancy, management, reserves, maintenance, taxes, insurance, utilities, debt service, and applicable capital expenditures before judging the property. The result should show operating cash flow after expenses, not gross rent presented as return.
Exit terms can reduce or delay the cash you expect to recover. Review loan seasoning requirements, refinance conditions, prepayment penalties, and payoff charges before counting refinance proceeds or a quick sale as available capital.
Use these guardrails before submitting an offer:
- Comp quality: Prefer recent, physically similar closed sales and discount weak evidence.
- Repair visibility: Separate hard costs, soft costs, and contingency.
- Time accounting: Convert monthly expenses and debt charges into the hold period you can defend.
- Rental realism: Calculate net operating cash flow, not gross rent.
- Exit verification: Confirm payoff, seasoning, and refinance terms with the lender.
A Pre-Offer Checklist and What a Good Template Covers
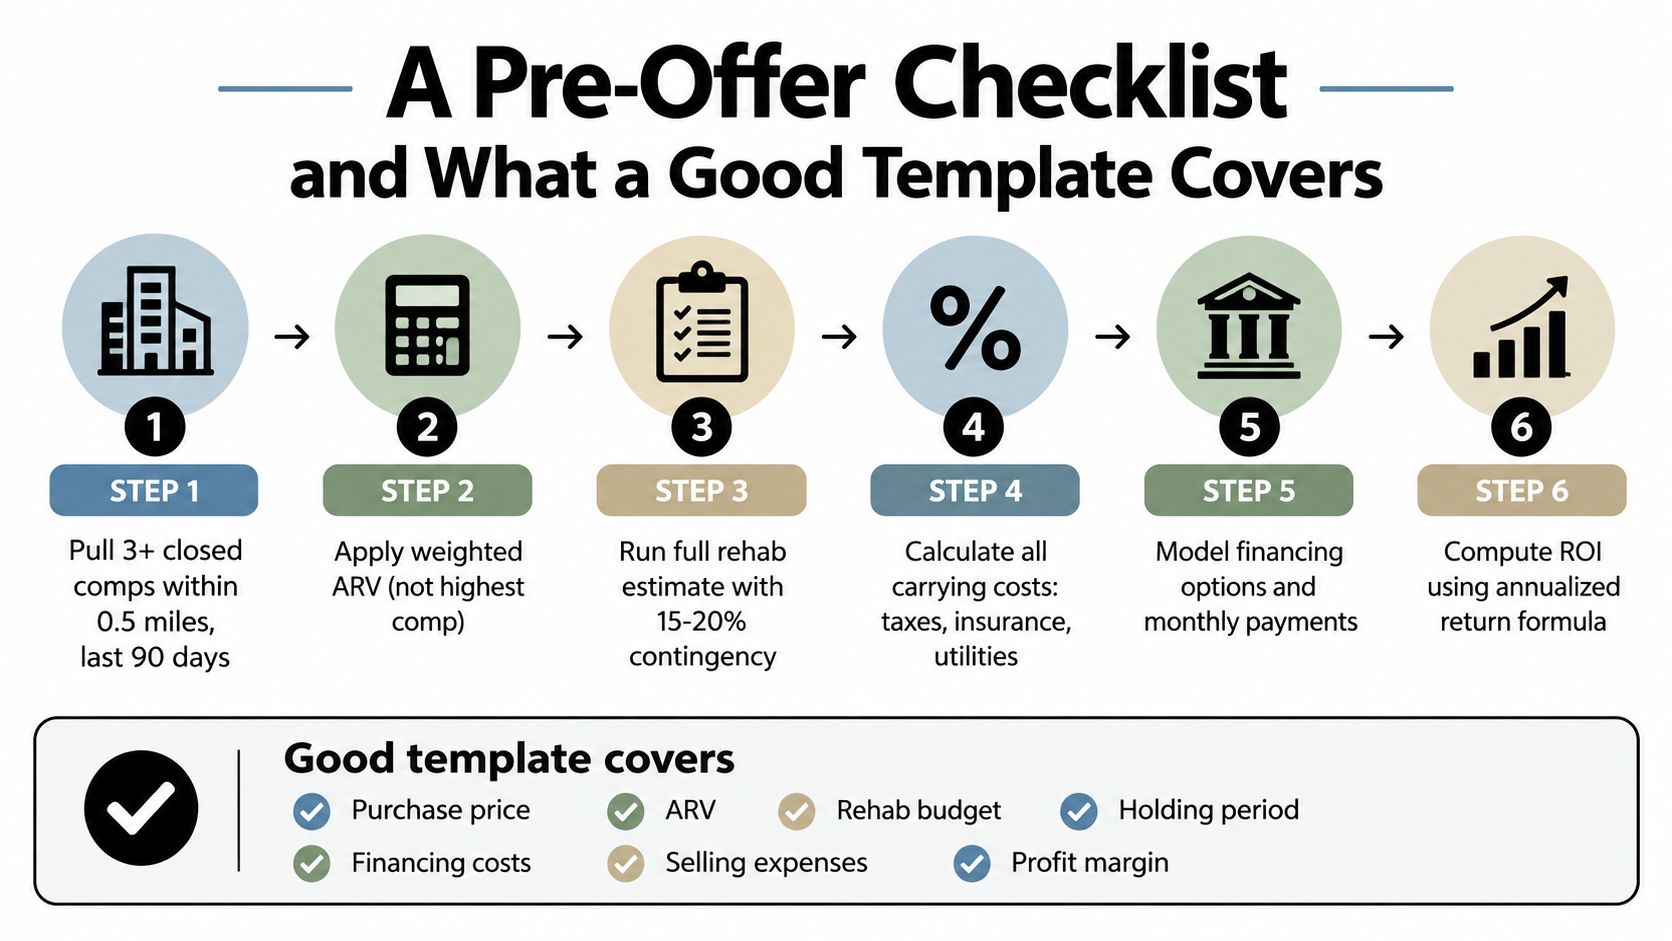
A disciplined offer process follows the same order every time. Start with evidence, then costs, then financing, then downside risk. Don't begin with the seller's asking price and work backward until the deal looks acceptable.
Run the numbers in a fixed sequence
- Pull at least 3 closed comps from the most relevant local area and recent sale period available.
- Adjust the comps for size, condition, features, lot utility, and market movement.
- Weight the adjusted indications and produce a defensible ARV.
- Build a line-item repair estimate with a 10% to 15% contingency.
- Project holding costs across the realistic renovation and sale window.
- Price at least two financing structures, including interest, points, draws, and payoff costs.
- Subtract purchase, sale, financing, holding, and tax expenses.
- Reject the deal if the downside case fails your required net margin.
A minimum margin is personal to your capital, experience, market, and risk tolerance. The supplied checklist uses a 20% net margin after taxes as a decision threshold, but that threshold should be tested against your actual cost of capital and project risk rather than copied blindly.
Automate the repetitive work
A good house profit calculator should automatically roll up repair categories, apply comp weights, calculate MAO, accrue interest over time, and separate gross profit from after-tax net profit. It should also include a sensitivity panel that reduces ARV by 10% and increases repairs by 15%, then shows the impact on profit, cash required, and break-even timing.
PropLab is one option for this workflow. Its underwriting tools calculate ARV and rehab estimates, apply distance and recency weighting to comparable properties, produce confidence indicators, and generate an MAO with repairs and profit margins included. Investors can use its offer-ready reports to review a deal with partners or lenders, while still validating the assumptions against inspections, contractor bids, and local market evidence.
The finished sheet should make the decision obvious. If the deal works only at the highest comp, the lowest repair estimate, the shortest hold, and the cheapest financing, it doesn't work. If it remains profitable after a weaker ARV, higher repairs, and a longer timeline, you have a deal worth investigating.
Use PropLab to organize comp-based ARV analysis, rehab estimates, MAO calculations, and offer-ready underwriting reports before you commit capital. Run your next property through the full cost and sensitivity workflow, then make the offer from the downside case rather than the headline spread.
About the Author
P
PropLab Team
Real Estate Analysis Experts
The PropLab team consists of experienced real estate investors, data scientists, and software engineers dedicated to helping investors make smarter decisions with AI-powered analysis tools.
Free tool
Get the ARV of any property in 30 seconds
Skip the spreadsheet. Enter an address and get an after-repair value backed by real comps.
