General
Most Accurate Property Value Estimator: A Practical Guide
September 17, 2026
16 min read
The most accurate property value estimator is the one with the tightest error band for the specific property type, market segment, and data availability you're underwriting. In a 2023 Brookings review, seven AVM providers predicted within 10% of the sales price for at least 95% of properties in a sample, yet off-market accuracy can deteriorate to roughly 7% to 7.7% error, according to independent 2026 summaries.
That contrast changes the question. There isn't one national winner that stays equally reliable for a listed suburban home, a rural property with few comparables, and a distressed acquisition being priced before it reaches the MLS. The strongest estimator is the one whose data, comparable selection, and confidence range match the decision in front of you.
A wholesaler needs fast triage before signing a contract. A fix-and-flip buyer needs a defensible After Repair Value, or ARV, and enough transparency to challenge the comp set. A lender needs an auditable valuation that supports collateral, loan-to-value, and downside analysis. Those workflows can require different tools, even when they evaluate the same address.
Why "Most Accurate" Depends on the Deal in Front of You
Accuracy is a conditional result, not a permanent product ranking. An estimator may perform well in a dense suburban neighborhood with frequent recent sales, then struggle with a rural home, an unusual layout, or an off-market property with limited buyer exposure. The Brookings review of AVMs emphasizes evaluating performance across counties, ZIP codes, and home-value ranges because error can vary by location and property segment. The FHFA review of AVM performance provides a stronger basis for judging those differences than a single national accuracy label.
Local comparables and data liquidity matter as much as the algorithm. A model can look accurate in aggregate while mispricing a low-liquidity rural property or a distinctive asset whose available sales do not describe the subject closely.
Three estimator families
Automated valuation models process property records, listing information, and transaction data quickly. They suit initial screening for listed homes, especially where comparable sales are recent and plentiful. Their reliability can weaken when public records are incomplete, improvements are unrecorded, the property has unusual features, or no current listing signal exists.
Manual comparable sales analysis depends on an agent, appraiser, or investor selecting and adjusting comparable properties. The process takes longer, yet an informed reviewer can account for street-level differences, condition, functional obsolescence, and buyer preferences that a standardized model may miss.
Hybrid platforms combine automated data processing with visible comparable selection, weighting, adjustments, and confidence scoring. They can give investors a faster starting point while preserving enough evidence to question an opaque single-number result.
Practical rule: Treat the estimator as a measurement instrument. Its usefulness depends on whether the instrument has the right evidence for the property being measured.
The workflow determines which weakness matters most. For wholesaling, a listed tract home may justify an AVM-led screen for quick triage. For flipping, an off-market acquisition with thin data requires reviewed comps and a wider risk allowance around the After Repair Value. Lending requires still more traceability because the valuation supports collateral and downside analysis. The same address can therefore call for different estimator types depending on whether the decision is an offer, a renovation budget, or a loan.
The Accuracy Metrics Investors Should Actually Read
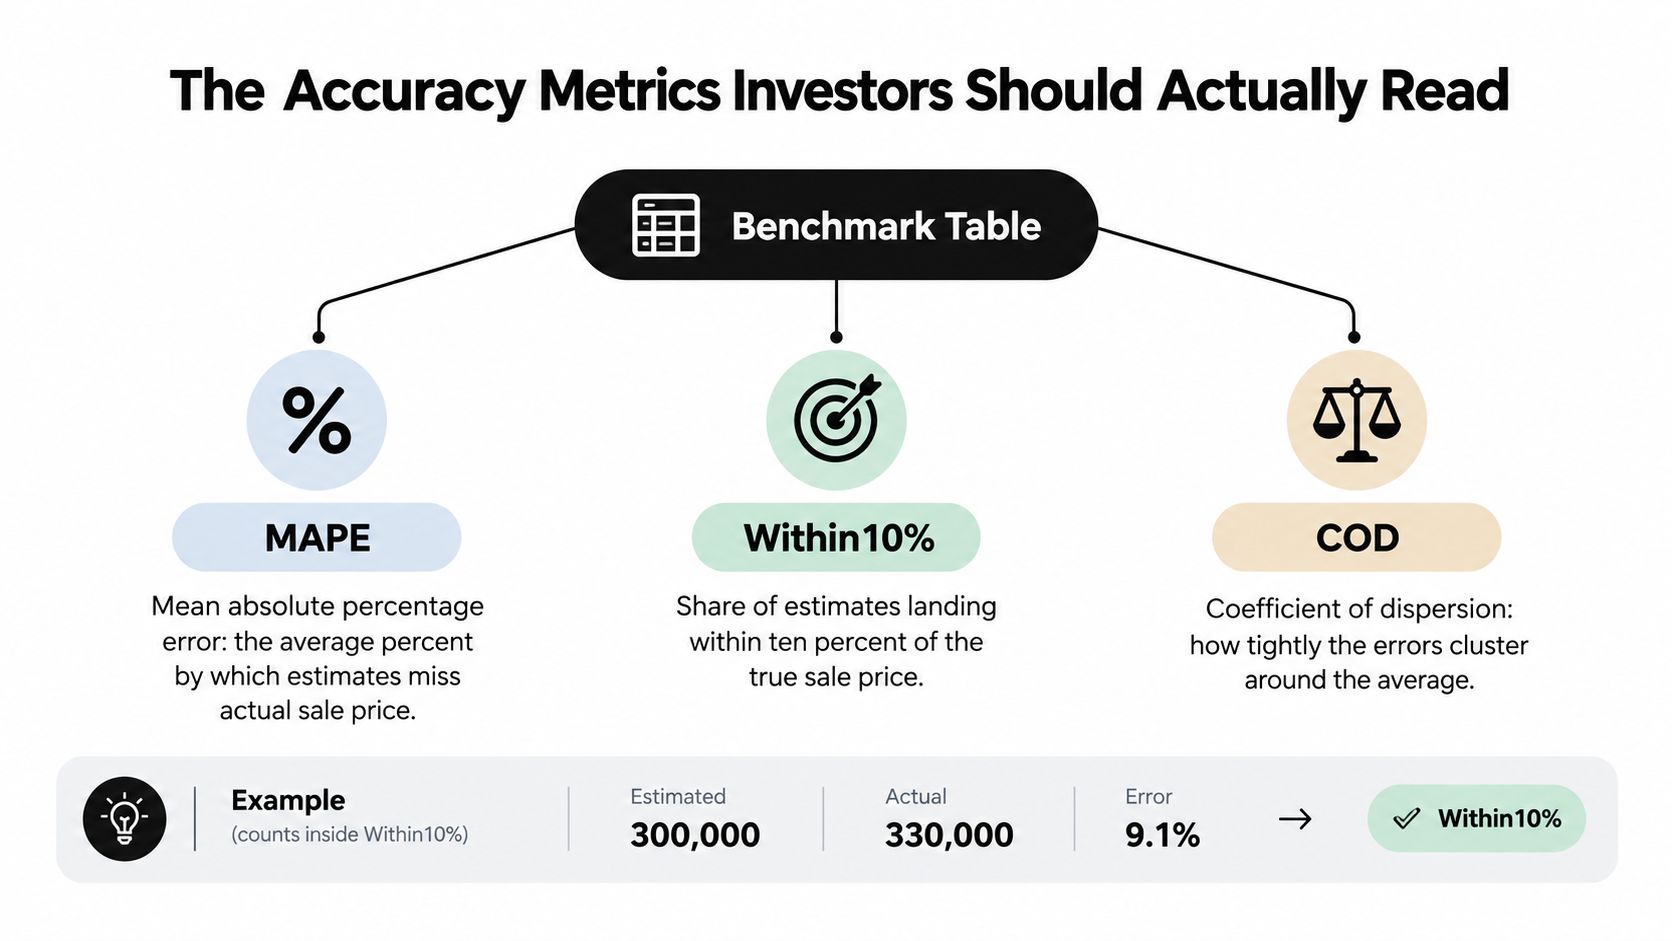
A valuation table can look impressive while hiding the risk that matters to your deal. Investors should read at least three measures: MAPE, Within10%, and COD.
Mean absolute percentage error, or MAPE, measures the average size of an estimator's miss without allowing overvaluation and undervaluation to cancel each other out. If one estimate is high and another is low by the same amount, MAPE still records both errors. The metric is useful for understanding typical magnitude, but it doesn't tell you whether the misses are tightly clustered across a neighborhood.
Within10% shows the share of estimates that land inside a band extending 10% above or below the actual sale price. Independent AVM benchmarking guidance also uses Within5, Within15, and Within20 to show how performance changes as the acceptable error band widens. Rossini's AVM accuracy guidance treats the sale price as the preferred ground-truth benchmark.
COD, or coefficient of dispersion, describes how consistently errors cluster around the average. A lower COD generally means the estimator behaves more consistently across the comparable set. It doesn't prove that the estimate is correct, but it helps identify unstable performance.
A short example
Suppose Estimator A has a MAPE of 6% and a COD of 18%. Estimator B has a MAPE of 8% and a COD of 4%. Estimator A misses by less on average, but its errors are more dispersed. Estimator B has a slightly larger average miss, yet its output is more consistent across the market.
For underwriting, Estimator B may be safer when the deal has a narrow margin because predictable error supports a more controlled downside assumption. Estimator A could still be useful for broad screening, but its dispersion warrants stronger comp verification.
A benchmark table should be read in context, not as a leaderboard. The same guidance identifies a commonly cited target around 13% MAPE, with 50% of estimates within ±10%, 65% within ±15%, and 80% within ±20%, alongside COD below 13 and COV below 17. Those figures are benchmarks, not guarantees for every market or asset.
For wholesaling, prioritize speed and the Within10 rate during initial screening, then verify the contract price with actual closed sales. For fix-and-flips, inspect MAPE, the high and low range, and comp dispersion because ARV error flows directly into the maximum allowable offer. For lending, consistency, auditability, and the quality of the benchmark matter more than a fast point estimate. Investors assessing their inputs should also review this data quality assessment guide.
AVMs, Manual Comps, and Hybrid Platforms Compared
The three estimator families solve different problems. AVMs optimize speed and scale. Manual comps optimize judgment. Hybrid platforms attempt to preserve automated efficiency while showing enough of the valuation logic for an investor to test it.
A national AVM can be effective when a property is listed, standardized, and surrounded by recent sales. It becomes less dependable when the property is off-market, rural, distressed, or materially different from the surrounding housing stock. Manual analysis can address those gaps, but the result depends heavily on the reviewer's experience and the quality of the comp search.
| Dimension | Automated AVMs | Manual Comps | Hybrid Platforms |
|---|---|---|---|
| Speed | Near-instant screening | Slower, because a reviewer selects and adjusts sales | Fast output with visible comp logic |
| Data depth | Broad records and market datasets | MLS and local market context, plus human inspection | Automated records combined with comp analysis |
| Transparency | Often limited to a range or confidence display | Adjustments can be explained directly | Designed to expose selection, weighting, and adjustments |
| Cost profile | Often low-cost or free for an initial estimate | Professional review carries a fee and time commitment | Varies by platform and usage |
| Best fit | Listed, conventional properties and pipeline triage | Unique, distressed, or judgment-heavy assets | Acquisition underwriting that needs speed and defensibility |
Where each approach breaks
An AVM may not see a renovated interior if the improvement isn't represented in the data. It may also select a geographically close sale that differs sharply in condition or buyer appeal. The model can process the wrong evidence efficiently.
Manual comps have the opposite risk. A reviewer can understand the asset better, but two reviewers may choose different sales or apply different adjustments. That subjectivity isn't automatically a flaw, but it needs documentation when the valuation supports a loan or a major acquisition.
Hybrid systems are most useful when the investor can inspect the underlying logic rather than accept a number without context. A transparent methodology should show why a sale was included, how distance and recency affected its weight, and which property differences changed the conclusion. PropLab's valuation methodology provides a relevant example of the type of process investors should look for.
For readers evaluating property valuation beyond the United States, a local specialist resource such as Forest Hill property valuers can help explain how professional valuation practice differs by market and property context.
The right choice depends on volume, asset class, and listing status. A wholesaler screening many addresses may begin with an AVM. A lender evaluating a complex collateral position may require an appraisal-grade review. A small acquisition team often gets the best balance from a hybrid workflow, provided it still validates the comps manually.
Real-World Accuracy Benchmarks That Separate the Estimators
Published benchmarks show why an aggregate accuracy ranking can mislead investors. A 2023 Brookings review found that seven AVM providers predicted within 10% of the sale price for at least 95% of properties in a sample, while warning that performance should be assessed by geography and price band. The result is strong for that sample, but it does not show that every property type receives equally reliable treatment. As noted earlier, AVM accuracy is conditional, not universal.
Appraisals provide a useful comparison, though they also contain systematic limitations. An FHFA appraisal study found that more than 90% of appraisals in its dataset matched or exceeded the associated contract price, with rural properties showing a notable tendency toward values above contract price. A separate appraisal-error study found an average absolute error of about 5% of value, after positive and negative errors offset. The appraisal-error research illustrates why a signed average can appear modest even when individual valuation errors remain material.
Machine-learning models can outperform simpler specifications in some empirical comparisons. One study reported 84.1% accuracy for XGBoost versus 42% for a hedonic regression baseline, while another reported MAE of 32.76, MAPE of 10.55%, and R² of 95.2% for a GA-GBR model. The published model comparison shows the value of modeling non-linear relationships. It does not establish that a model trained on one dataset will transfer unchanged to another county.
| Estimator | Median Error On-Market | Median Error Off-Market | Distressed or Rural | Best Use Case |
|---|---|---|---|---|
| AVM | Stronger when recent sales and listing data are available | Can widen sharply with thin records | Higher uncertainty | Fast screening of conventional homes |
| Manual comps | Depends on reviewer and selected sales | Better suited to judgment-heavy analysis | Can account for condition and uniqueness | Complex acquisitions and verification |
| Hybrid platform | Combines automated speed with comp review | Designed to expose data gaps and confidence | Useful when the output flags uncertainty | Offer analysis and repeatable underwriting |
| Advanced machine-learning model | Can outperform linear baselines in tested datasets | Transferability depends on local training data | Requires careful calibration | Feature-rich market prediction |
The most useful benchmark for investors is the gap between on-market and off-market properties. Independent summaries of 2026 accuracy data report median errors around 1.7% to 2.4% for on-market properties, compared with roughly 7% to 7.7% off-market. For a $500,000 off-market property, that range implies a possible error of about $35,000 or more. The 2026 accuracy summary connects the difference to actual acquisition timing, since underwriting often begins before MLS exposure.
The workflow implications are direct. Wholesalers can use an AVM to screen conventional leads, then escalate candidates whose error band threatens the assignment spread. Flippers need a comp review that tests condition and buyer appeal before setting an offer. Lenders and investors assessing rural, distressed, or unique collateral should require an appraisal or broker price opinion when the valuation supports a financing decision. A number that works for on-market triage may be too weak for an off-market purchase or loan file.
How Hybrid Estimators Like PropLab Build a Verifiable Valuation
A hybrid valuation becomes useful only when an investor can follow the path from raw records to final value. The process starts with comparable selection, not with a polished number. A system should identify closed sales that resemble the subject, then show how location, date, size, condition, and other differences affect their relevance.
Distance weighting gives nearby sales greater influence, but proximity alone isn't enough. A sale across a neighborhood boundary may be less comparable than one slightly farther away with the same housing stock and buyer pool. Recency weighting gives newer transactions greater relevance when market conditions have changed, while older sales may still help when the local comp supply is thin.

What the investor should be able to challenge
A verifiable engine should expose the adjustment logic. For a single-family rental, that can include gross living area, lot size, condition, and concessions. Instead of presenting an unexplained final figure, the platform should show each adjustment as a dollar delta or an equivalent transparent change, allowing the investor to ask whether the comparison is reasonable.
The confidence score should reflect evidence quality, not act as a decorative badge. Comp density and variance are central inputs. A dense set of similar closed sales supports more confidence than a scattered set of older or materially different transactions. A wide spread among relevant comps should widen the valuation range, even if the midpoint looks attractive.
PropLab's machine-learning explanation offers useful context for understanding why a modern model may capture non-linear relationships, but investors still need local validation. A model alone doesn't eliminate the need to inspect the street, the condition, and the actual comp set.
The mechanics can be illustrated with a hypothetical mid-tier metro rental. An investor enters the subject address, reviews the nearest relevant closed sales, checks how recency and distance affect their weights, and examines the adjustments for size, lot, condition, and concessions. The resulting ARV should be read as a range with a confidence signal, not as a guaranteed resale price.
The critical test is whether the output supports the transaction math. If the ARV changes materially when one questionable comp is removed, the investor should widen the downside case or obtain a manual review. A hybrid engine earns trust by making that sensitivity visible.
The valuation view is only one part of the underwriting workflow. The investor must still subtract realistic repairs, financing costs, holding costs, selling expenses, and the required profit margin before setting an offer.
Matching the Estimator to Your Investor Workflow
The best estimator depends on what happens after the number is produced. Investors shouldn't select a tool only because it reports a narrow historical error rate. They should select the tool that protects the decision they're about to make.
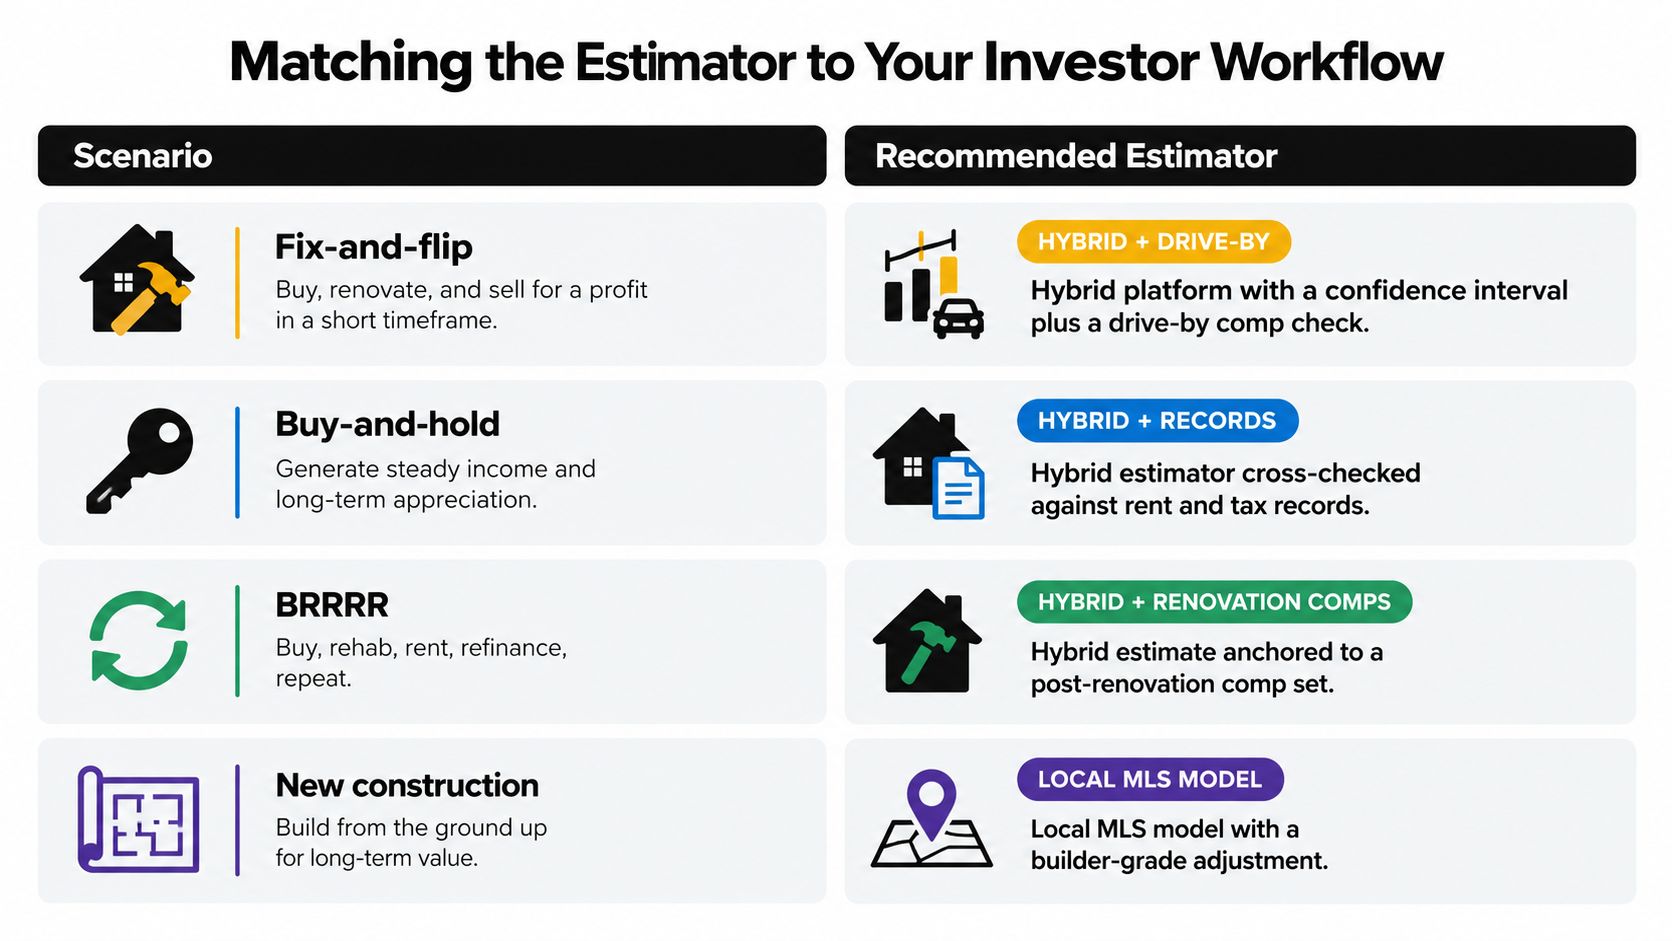
Fix-and-flip
A hybrid estimator is generally the practical starting point because the buyer needs both speed and an explainable ARV. The confidence interval should fit inside the spread between the proposed purchase price, renovation budget, transaction costs, and required profit. A drive-by comp check remains important because exterior condition, street appeal, and block-level differences can invalidate an apparently comparable sale.
Wholesaling
Use a fast AVM to triage opportunities and avoid spending manual analysis time on every lead. Before signing or assigning a contract, review the closed comps and test whether the estimate supports the assignment price after accounting for the end buyer's margin. Off-market uncertainty matters most here because the deal is often priced before listing data can improve the model.
Buy-and-hold rentals
A hedonic or hybrid estimator can provide the value baseline, but rental investors must connect it to rent evidence, taxes, insurance, operating expenses, and financing. A property can be correctly valued and still be a poor acquisition if the income doesn't support the debt service and operating assumptions.
Lending and BRRRR
Lenders need a valuation with an audit trail. For BRRRR projects, the relevant number is the post-renovation value, so the comp set must resemble the finished property rather than its current condition. A hybrid estimate can organize the evidence, but a licensed appraiser review may be necessary when the loan depends on a tight loan-to-value outcome.
New construction deserves separate caution. A local MLS model with builder-grade adjustments may be more appropriate than a generic AVM because builder incentives, finish packages, and competing inventory can distort comparisons. The output should be stress-tested against the nearest completed projects and the actual specification of the subject.
A Practical Checklist and Red Flags Before You Trust the Number
A property value estimate becomes underwriting evidence only after you test its inputs. Start with the comp set, not the headline figure. Pull a second source where possible, confirm that the sales reflect the same buyer pool, and inspect whether the model has selected properties that resemble the subject.
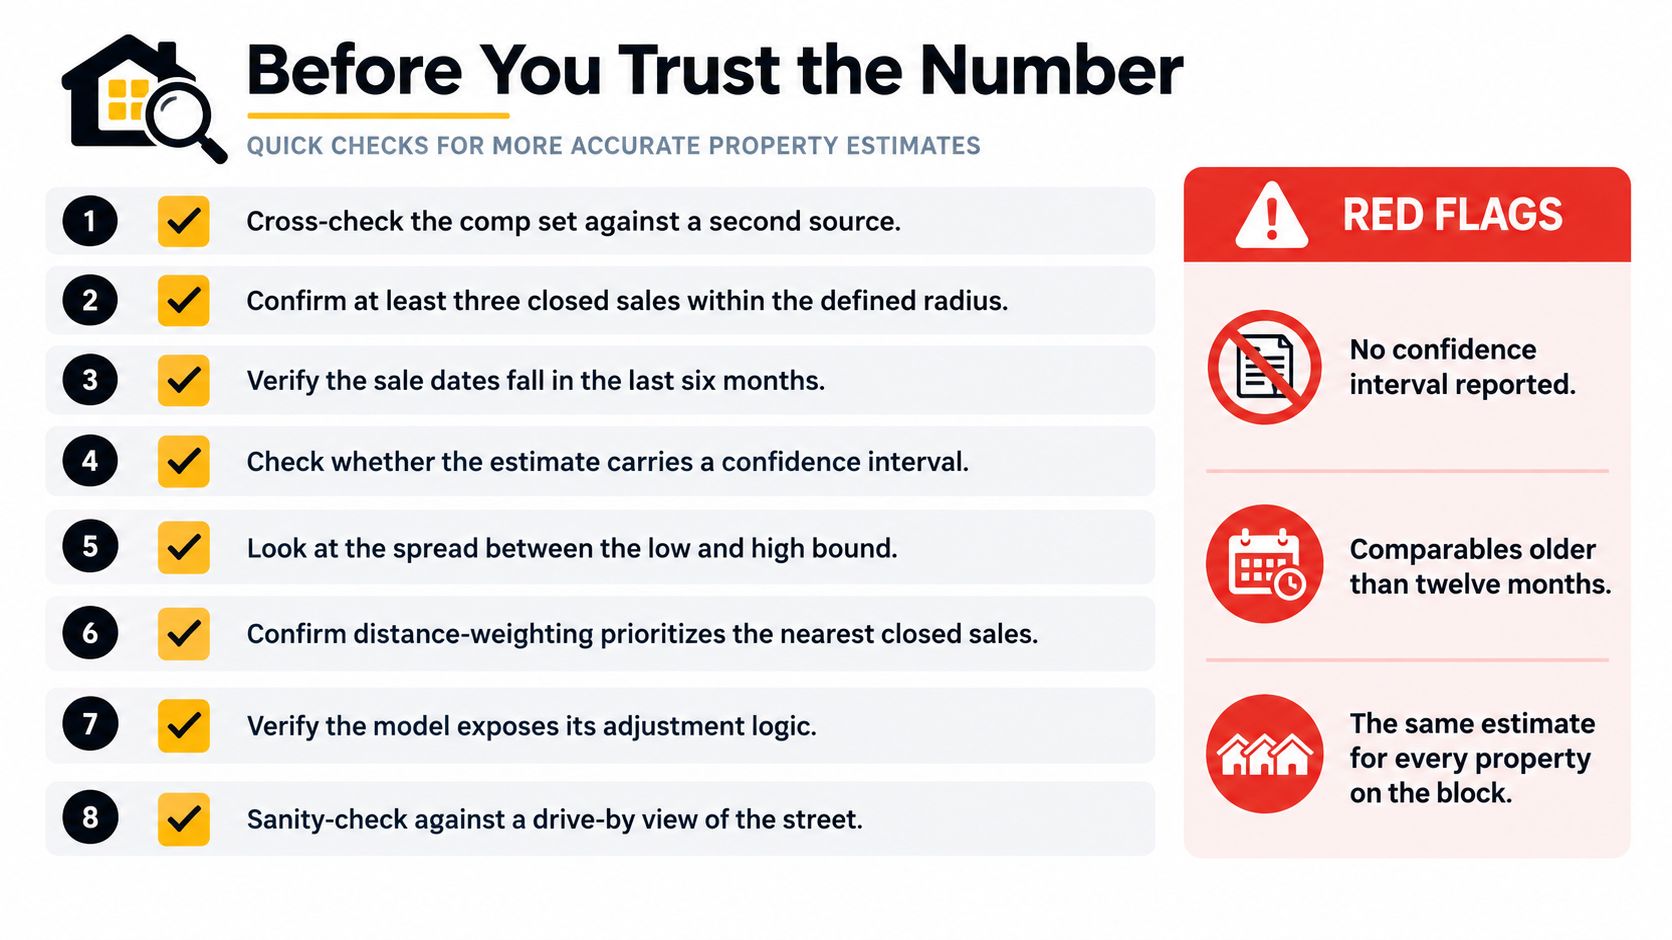
Use this checklist before relying on an estimate for an offer, ARV, or loan decision:
- Cross-check the comp set: Compare it with a second data source or manual MLS pull.
- Confirm closed-sale depth: Look for at least three relevant closed sales inside the defined radius.
- Verify sale timing: Check whether the transactions fall within the platform's stated time window.
- Demand a confidence interval: A point estimate without uncertainty is incomplete.
- Inspect the low and high bounds: Compare the spread with your MAO, DSCR, or LTV tolerance.
- Review distance weighting: Confirm that the nearest comparable sales receive appropriate influence.
- Challenge the adjustments: Verify that size, lot, condition, and concessions align with the property you inspected.
- Perform a street-level sanity check: A drive-by view can reveal traffic, deferred maintenance, adjacency, or block conditions that records miss.
Red flags that override the model
Stop and investigate when the estimator reports missing or stale comps inside the subject's subdivision. Atypical properties with low confidence deserve manual analysis, especially if the comp pool contains recent distress sales that could pull the value downward.
Be cautious when the same estimate appears for multiple properties on a block, when the model gives no confidence interval, or when its adjustments can't be traced to observable features. If the valuation spread exceeds your deal margin, reconcile it with a manual CMA rather than averaging several numbers and calling the result accurate.
The disciplined investor uses an estimator as one input in a larger underwriting model. The final decision must survive a conservative ARV, realistic repair scope, financing assumptions, and the possibility that the resale market won't validate the model's midpoint.
PropLab provides address-based ARV analysis, comparable-sales weighting, adjustment breakdowns, confidence scoring, and offer-ready underwriting outputs for investors evaluating acquisitions. Use PropLab to test your next off-market deal, challenge the comp set, and turn the valuation into a documented offer decision.
About the Author
P
PropLab Team
Real Estate Analysis Experts
The PropLab team consists of experienced real estate investors, data scientists, and software engineers dedicated to helping investors make smarter decisions with AI-powered analysis tools.
Free tool
Pull comps for any address
Comparable sales with adjustments, ready to defend in front of a seller or a lender.
