General
Real Estate Underwriting Model: Key Components for 2026
September 27, 2026
16 min read

You've got a property under contract, the seller's pro forma looks attractive, and the clock is moving. Then you open the deal sheet and realize the most important figures, resale value, repair scope, financing cost, and exit assumptions, are still guesses. A real estate underwriting model turns that uncertainty into a decision you can explain to a lender, partner, or investment committee.
The model isn't a magic offer calculator. It's a disciplined way to connect property facts, market evidence, costs, debt, timing, and risk. In a more conservative 2025–2026 environment, that discipline matters because lenders and investors are scrutinizing assumptions more closely, using lower borrowing ratios, higher DSCR thresholds, and more restrained rent expectations. Matthews describes this shift in its 2026 multifamily underwriting playbook.
What a Real Estate Underwriting Model Actually Does
A real estate underwriting model is a structured financial test. It translates a property and a proposed price into three practical outputs: how much the asset could be worth, what the deal will require, and whether the risk-adjusted return justifies proceeding.
Think of the model as a flight simulator for the acquisition. You enter the aircraft's condition, fuel load, weather, and destination. The simulator doesn't guarantee a safe landing, but it shows whether the plan works under reasonable conditions. A property model performs the same job with purchase price, repairs, income, financing, timing, and exit value.
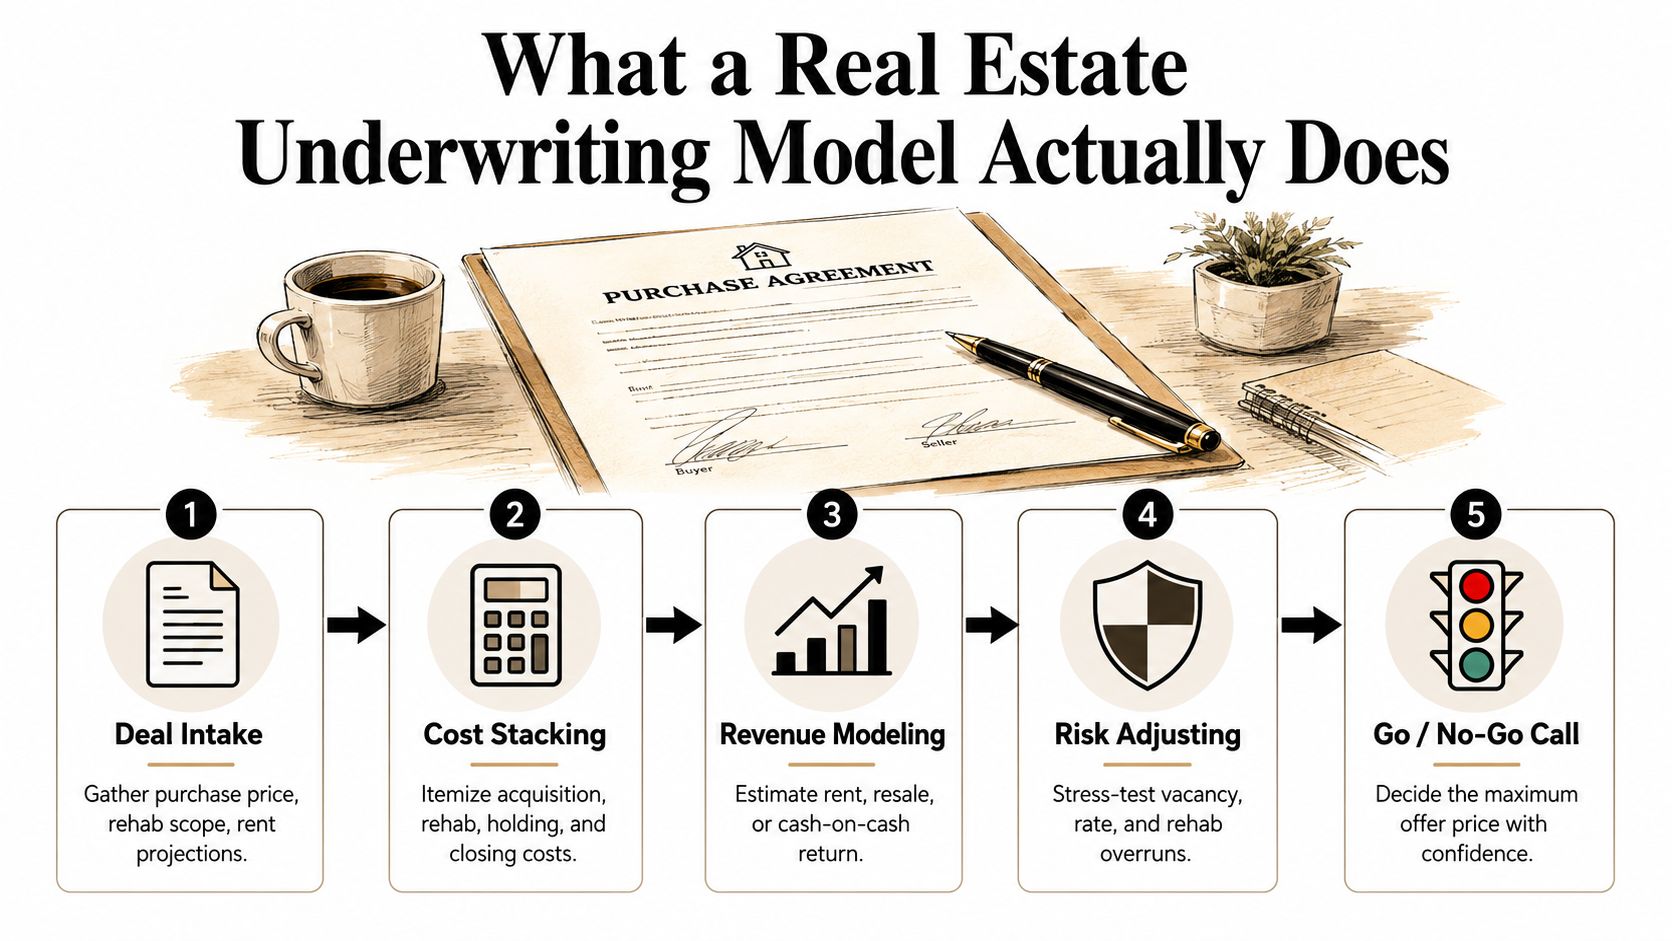
The four jobs inside the model
First, estimate the property's future value. A fix-and-flip model usually centers on after-repair value, or ARV. A rental model focuses more on stabilized income, operating expenses, debt service, and the value supported by that income.
Second, stack every cost. Acquisition costs include the purchase price and closing expenses. The project may also require construction, permits, inspections, utilities, insurance, taxes, financing fees, selling costs, and a reserve for surprises. A rounded repair allowance can make a weak deal look viable, so the model should reflect a written scope rather than a hopeful placeholder.
Third, layer in financing. Loan-to-value, interest rate, points, repayment structure, equity requirements, and the length of the hold all change the amount of capital at risk. The same property can produce very different returns under different debt terms.
Fourth, convert the analysis into a decision metric. For a flip, that might be maximum allowable offer, profit, or return on invested capital. For a rental, it might be cap rate, cash-on-cash return, debt service coverage ratio, or internal rate of return.
The spreadsheet is only the container. The main work is deciding whether each input is supported, how sensitive the result is, and how much confidence you should place in the output. Local context also matters. Property investors can use neighborhood guides and articles to understand features, amenities, and surrounding conditions that a basic financial sheet may overlook.
Practical rule: A model should tell you not only what the deal returns, but which assumption could make the return disappear.
The Five Core Components Every Model Needs
Consider a 1,400-square-foot single-family home bought for $180,000, with a planned $40,000 rehabilitation and a six-month timeline. The figures describe the deal structure, not its profitability. Profit depends on what the property will be worth, how reliable the cost plan is, how the capital is priced, and what return you require.
1. Value after the work
For a flip, begin with ARV. For a rental, estimate stabilized value from sustainable income rather than from the seller's preferred price. Comparable properties should resemble the subject in size, location, condition, layout, and finish level.
A higher ARV raises the amount you can theoretically pay. It also creates danger when the estimate relies on superior homes, distant sales, or renovations the budget won't deliver.
2. Comparable evidence
Comps support both resale value and rent assumptions. A useful set isn't just a list of nearby listings. It distinguishes closed sales from asking prices, filters for relevance, and records why one property deserves more or less weight than another.
If a comparable has better finishes, a larger lot, or a more functional floor plan, adjust downward. If the subject will be materially better after renovation, adjust upward only when the scope supports that conclusion.
3. A line-item repair scope
The $40,000 rehabilitation budget needs to become a list. Break it into demolition, exterior work, mechanical systems, kitchens, bathrooms, flooring, paint, permits, cleanup, and other applicable categories. Add a contingency as a separate line so you can see the cost of uncertainty instead of hiding it inside a vague total.
A larger repair budget reduces the offer ceiling dollar for dollar in a flip model. It can also delay completion, increasing interest, taxes, insurance, utilities, and opportunity cost.
4. Financing and holding costs
Debt terms influence both required cash and the return on that cash. Include LTV, interest rate, points, lender fees, draw terms, and the expected funding schedule. Then add carrying expenses, including taxes, insurance, utilities, maintenance, and selling costs where relevant.
The six-month timeline is an assumption, not a fact. If construction or resale takes longer, the model should show the effect rather than treating the original schedule as guaranteed.
5. The return target
A flip commonly uses expected profit, profit margin, or ROI. A rental may use cap rate, cash-on-cash return, DSCR, equity multiple, and IRR. Each metric answers a different question, so don't let one attractive result conceal a weak answer elsewhere.
| Component | What It Captures | Metric It Moves | Common Pitfall |
|---|---|---|---|
| Value estimate | Resale or stabilized property value | ARV, valuation, MAO | Using superior or weakly comparable properties |
| Comparable set | Market evidence for price and rent | ARV, rent, cap rate | Treating asking prices as closed-sale evidence |
| Repair scope | Work required to reach the target condition | MAO, profit, equity need | Relying on a rounded allowance |
| Financing | Cost and structure of borrowed capital | Cash-on-cash, equity need, DSCR | Ignoring points, draws, or time-related costs |
| Return target | Required compensation for risk | Offer ceiling, go or no-go | Choosing a metric that hides downside |
The key lesson is directional. Higher value can support a higher offer, higher repairs reduce it, more expensive debt lowers equity returns, and stronger required returns reduce what you should pay.
Modeling Approaches from Spreadsheet to AI
Your modeling method should match the number of deals you review and the level of scrutiny your output will face. A solo investor reviewing occasional acquisitions has different needs from an acquisitions team sending reports to lenders and equity partners.
Custom spreadsheets
Excel or Google Sheets gives you maximum control. You can create separate tabs for assumptions, sources, monthly cash flow, debt amortization, sensitivity analysis, and returns. The structure is transparent when formulas are labeled and inputs are separated from calculations.
The weakness is maintenance. A broken formula, stale comp, or hidden hard-coded assumption can survive unnoticed. Spreadsheet models also depend heavily on the builder's discipline, so two analysts may produce different answers from the same property.
Template-based software
Established flip calculators, rental templates, and broker-provided models reduce setup time. They standardize the fields partners see and can make routine deals easier to compare.
The trade-off is flexibility. A template designed for a straightforward flip may not handle a complex renovation, phased lease-up, unusual financing, or a detailed downside case. Before relying on one, test whether you can inspect formulas, change assumptions, and export an audit trail.
AI-powered underwriting
AI tools can gather public records, identify possible comps, draft assumptions, and produce a starting model quickly. That speed is useful when an acquisitions team needs to screen a large pipeline, but it creates a new diligence requirement: you must understand where the inputs came from and how the system selected them.
Recent commercial real estate coverage describes growing use of AI and automation while emphasizing hybrid workflows, human review, and stronger diligence. Crexi's discussion of commercial real estate underwriting is useful context for evaluating that balance.
| Approach | Speed | Transparency | Auditability | Best Fit |
|---|---|---|---|---|
| Custom spreadsheet | Moderate to slow | High when built clearly | High, if formulas and sources are documented | Analysts needing control |
| Template software | Fast for familiar deals | Moderate | Moderate, depending on access to calculations | Repeatable acquisition types |
| AI-powered underwriting | Fastest for initial screening | Varies by source disclosure | Strong only when citations and adjustments are visible | Teams processing active pipelines |
If you're evaluating machine learning in property analysis, this overview of machine learning in real estate provides useful background. The practical standard is simple: use automation to accelerate research, not to bypass review.
Assumptions That Quietly Make or Break Your Numbers
The most dangerous assumptions often look reasonable in isolation. A rent-growth line appears modest. A vacancy reserve seems adequate. A flat exit cap feels neutral. A six-month timeline looks achievable. Together, those choices can make the model depend on a favorable sequence of events.
Rent growth and vacancy
The 2025–2026 market requires more restraint than a seller's pro forma may show. Current underwriting commentary points to rent-growth expectations of roughly 1–2% in many markets, with some investors modeling flat rents in the first or second year. Matthews outlines this reset in rent-growth expectations.
Use rent growth only when local evidence supports it. For a new acquisition, ask whether the rent comes from signed leases, recent closed transactions, or an optimistic projection. Vacancy should reflect the asset's location, tenant profile, turnover, and lease-up risk, rather than serving as a universal plug.
Exit cap and financing
A flat exit cap assumes the market will value future income at the same yield as today. That may be acceptable as a base case, but it isn't a complete risk test. A higher exit cap lowers the value of the same income, which reduces proceeds and can weaken equity returns.
Debt requires similar care. Lenders are using tighter standards, lower LTVs, and higher DSCR thresholds in the conservative market described by Matthews. Rate assumptions should be tested against the actual term sheet, not against the cheapest debt you hope to find.
Timeline and contingencies
A rehab contingency doesn't protect a model from an unrealistic schedule. Permit delays, material availability, inspections, contractor sequencing, and resale time can all extend the hold. Every additional period adds carrying costs and may postpone the return of equity.
| Assumption | Optimistic Input | Conservative Input | Impact on Returns |
|---|---|---|---|
| Rent growth | Seller-supported upside projection | Flat or restrained local outlook | Lower growth reduces future NOI and value |
| Vacancy | Minimal interruption | Reserve aligned with tenant and market risk | Lower effective income reduces DSCR and cash flow |
| Exit cap | Unchanged from acquisition | Higher stress-case exit cap | Lower terminal value and equity proceeds |
| Rehab timeline | Best-case completion | Delayed completion case | Higher carry costs and slower capital recovery |
| Debt terms | Favorable quote without buffer | Confirmed terms with conservative sensitivity | Lower leveraged returns and possibly higher equity needs |
Write a rationale beside every important line. A lender can forgive uncertainty that is visible and tested. They're less likely to trust a model whose precision hides unsupported optimism.
How Comps, Adjustments, and Confidence Scoring Fit Together
A comp set becomes defensible when another person can follow your selection and adjustment logic without asking you to explain every cell. Start with closed sales that resemble the subject, then rank them by distance, recency, condition, size, layout, lot, location, and concessions. The goal isn't to find a perfect comp. It's to build a relevant group and show how each difference affects the conclusion.
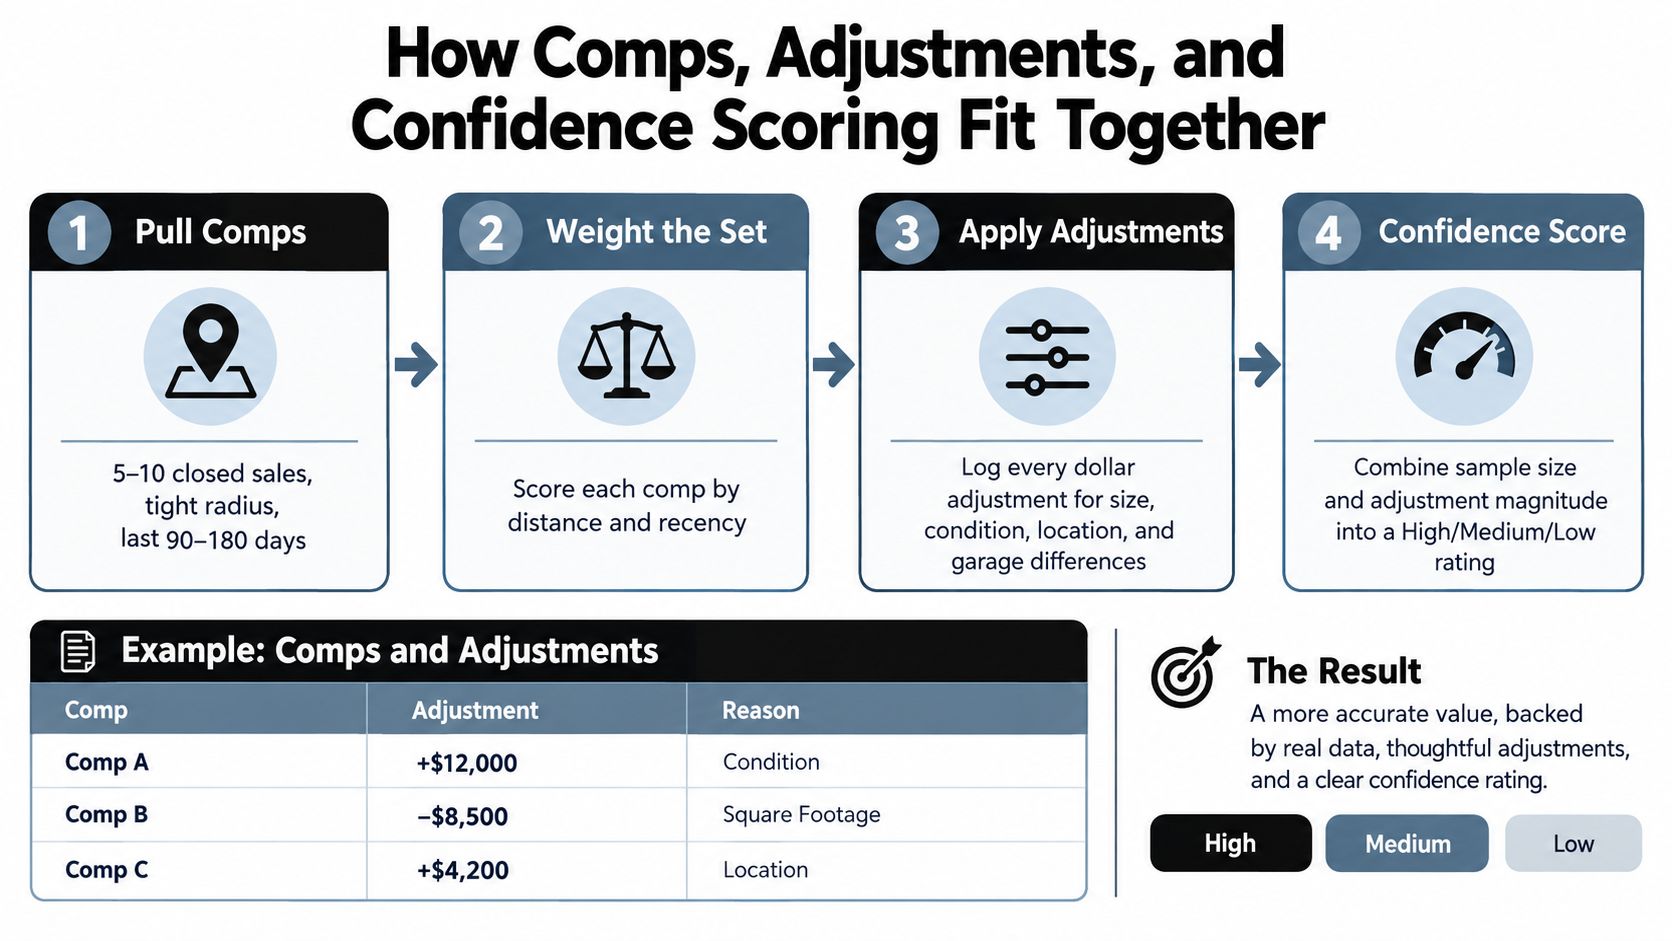
Make every adjustment inspectable
Suppose one comparable is in better condition, another is smaller, and a third benefits from a stronger location. Record the adjustment and its reason instead of simply changing the comp's value in a hidden cell. A lender should be able to see whether the adjustment is based on paired sales, local evidence, contractor input, or analyst judgment.
This transparency matters more when an AI system is involved. The tool may identify relevant properties quickly, but you still need to inspect the source records, selection criteria, condition assumptions, and adjustment logic. A valuation that produces one clean number without showing its inputs isn't automatically reliable.
Turn uncertainty into a confidence rating
Confidence scoring shouldn't be confused with probability. It's a communication device that summarizes evidence quality. A high-confidence estimate may have closely matching sales, recent market activity, modest adjustments, and consistent condition evidence. A low-confidence estimate may depend on distant properties, large adjustments, thin evidence, or uncertain renovation outcomes.
A lower ARV with strong support is often more useful than a higher ARV built on fragile comps. The conservative figure gives you a clearer offer ceiling and makes negotiation with capital partners easier.
For a deeper explanation of the underlying process, see comparable sales analysis for real estate.
Here is a short walkthrough of how an underwriting system can organize that evidence:
A practical workflow combines comp relevance, adjustment magnitude, and input completeness into a rating such as High, Medium, or Low. The score should sit beside the valuation, not replace it. Your investment committee still needs to know what could change the number.
Stress Testing Your Model Against a Conservative Market
Sensitivity analysis asks a straightforward question: what happens if one important input moves against you? Keep the rest of the model stable, change one variable, and read the effect on MAO, DSCR, cash-on-cash return, or equity multiple. Scenario analysis then combines several adverse changes to show whether the deal survives a difficult outcome.
Build three cases:
- Base case: Use the most supportable value, repair scope, financing, rent, and timeline.
- Downside case: Apply a 10% ARV reduction, a 15% rehabilitation overrun, and a 90-day hold extension. These are scenario inputs specified for this example, not market forecasts.
- Stress case: Combine rent compression with a rate shock and the other adverse assumptions your lender considers plausible.
Those downside inputs directly show why the base case can't be the only decision point. A lower ARV reduces proceeds, an overrun consumes equity, and a longer hold adds carrying costs. For a rental, weaker rent and more expensive debt can pressure both cash flow and DSCR.
| Metric | Base Case | Downside Case | Stress Case |
|---|---|---|---|
| ARV or stabilized value | Supported central estimate | Lower value after the specified haircut | Lower value plus weaker income outlook |
| Rehabilitation | Written scope | Scope plus specified overrun | Overrun with delayed completion risk |
| Hold period | Planned timeline | Plan plus specified extension | Extension with financing pressure |
| Debt service | Confirmed terms | Same debt with weaker proceeds | Higher rate assumption |
| Decision use | Initial offer framework | Negotiation ceiling | Go or no-go threshold |
When your model exceeds the lender's appraisal-driven value, don't just argue that your spreadsheet is right. Separate the disagreement into levers: reduce price, request a seller credit, remove nonessential scope, increase equity, change the financing structure, or abandon the deal. A fundable deal is one that works for the capital provider as well as the buyer.
Validating Confidence and Risk Before You Make an Offer
The lowest offer isn't always the safest offer. An aggressive bid based on weak comps, incomplete repairs, and an unsupported exit can signal more risk to lenders and partners than a slightly higher offer with documented evidence and a tested margin.
Use a final validation pass before submitting:
- Verify the comp set: Confirm that the sales are relevant to the property's neighborhood, size, condition, and intended finish level. Use a consistent time and distance policy rather than selecting only the sales that support your preferred ARV.
- Verify the rehabilitation: Match every major line item to a contractor walkthrough, bid, inspection finding, or other identifiable source. A contingency can't repair a scope that was incomplete from the start.
- Reconcile the debt: Compare your assumed LTV, DSCR, rate, points, reserves, and repayment structure with the lender's actual requirements.
- Document adjustments: Keep the reason and source beside each material comp adjustment. If someone else can't reproduce your logic, your confidence score should fall.
- Test the exit: Flex exit cap and rent growth. Flag any single assumption that moves MAO by more than 10%, using that threshold as an internal review trigger rather than a universal market rule.
- Require another reviewer: Have a second person sign off before the offer leaves your team.
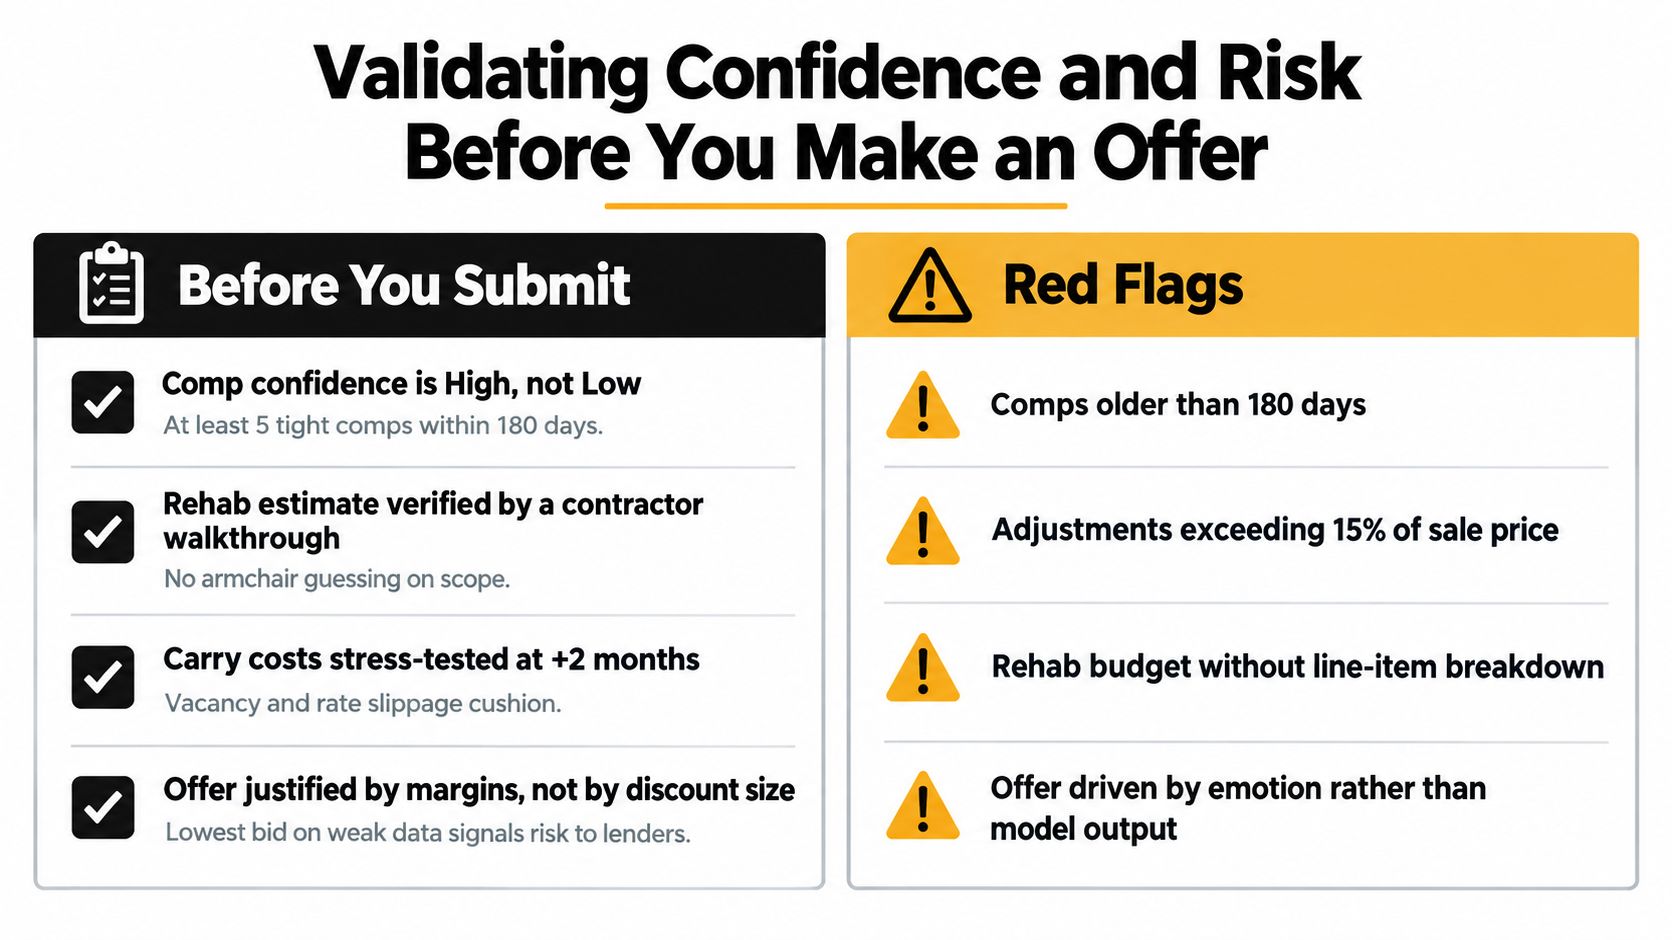
Confidence also compounds across inputs. A deal may have strong ARV evidence but weak repair support, or excellent contractor pricing but uncertain demand. Treat those weaknesses separately instead of averaging them into a reassuring single score. A structured confidence rating scale can help teams apply the same language across acquisitions.
When you can't visit a property promptly, virtual tours for investors can provide additional visual context for condition review, though remote evidence shouldn't replace inspections or contractor verification.
A defensible offer is not merely the lowest number. It's the price supported by evidence, tested against adverse conditions, and clear about what remains uncertain.
PropLab helps investors underwrite properties by estimating ARV, organizing comparable sales, modeling rehab costs, and producing offer-ready reports with adjustment breakdowns, confidence scoring, and risk indicators. Visit PropLab to turn your next deal sheet into a faster, more transparent decision.
About the Author
P
PropLab Team
Real Estate Analysis Experts
The PropLab team consists of experienced real estate investors, data scientists, and software engineers dedicated to helping investors make smarter decisions with AI-powered analysis tools.
Free tool
Get the ARV of any property in 30 seconds
Skip the spreadsheet. Enter an address and get an after-repair value backed by real comps.
