General
Residential Real Estate Comps How to Find and Adjust
September 18, 2026
16 min read

You've found a house that looks like a spread. The purchase price works, the renovation seems manageable, and a nearby sale appears to support the after-repair value. Then you notice the “comp” is a different property type, sold with a large builder incentive, and sits in a separate buyer submarket. The deal didn't become bad at closing. It became bad when the valuation was built on the wrong evidence.
Residential real estate comps are a profit-protection tool, not a checkbox. The strongest analysis weighs distance, recency, physical similarity, condition, transaction terms, and data reliability before producing an ARV or offer price. That matters even more when sales are limited and the closest recent transaction isn't genuinely comparable.
Why Accurate Residential Comps Make or Break Your Deal
A weak comp can make a flip look profitable while hiding the exact risk that later consumes the margin. An investor sees a renovated home nearby, copies its sale price, subtracts a repair estimate, and assumes the spread is real. The problem is that proximity alone doesn't prove substitutability. Buyers may have viewed those properties as different choices because of school boundaries, street traffic, lot utility, architectural style, renovation quality, or neighborhood identity.
The formal sales-comparison approach is more disciplined. The National Association of REALTORS' residential appraisal guide describes comparables as recently sold or listed properties with similar utility, quality, age, amenities, and location. The appraiser compares the subject with those sales and adjusts for meaningful differences. That process is very different from averaging a neighborhood's broad sale prices or trusting an automated estimate without inspecting the underlying transactions.
Quantity helps, but quality carries the decision
Federal Housing Finance Agency analysis of Enterprise-backed mortgages found that appraisals used an average and median of five comps, while the modal number was six. More than two-thirds of appraisals from 2013 through 2021 used at least five comparables, even though only three were required, according to the FHFA analysis of comparable-property counts. That doesn't mean every investor needs a fixed number. It shows that practitioners often need a broader evidence set to understand the market and reconcile differences.
The same analysis found that the share of appraisals using five or more comps declined from 76% in 2013 to 59% in 2021, a 17-point drop, and varied from 34% in Mississippi to 90% in California. Rural areas used five or more comps 13 percentage points less often than high-density urban areas. Those differences matter because a comp strategy that works in a dense subdivision may fail on acreage or in a thinly traded neighborhood.
Practical rule: A confident valuation isn't the one with the highest sale. It's the one where every important difference has a defensible explanation.
Before making an offer, you should know which sales carry the valuation, which ones only provide context, and what would make you reduce the number. A weighted model can process distance, recency, adjustments, and data quality quickly. Manual judgment still matters when the subject is unusual, concessions are unclear, or the available sales don't represent the same buyer pool. Use automation to expose the evidence. Don't use it to avoid reviewing the evidence.
Finding the Most Relevant Comps Without MLS Access
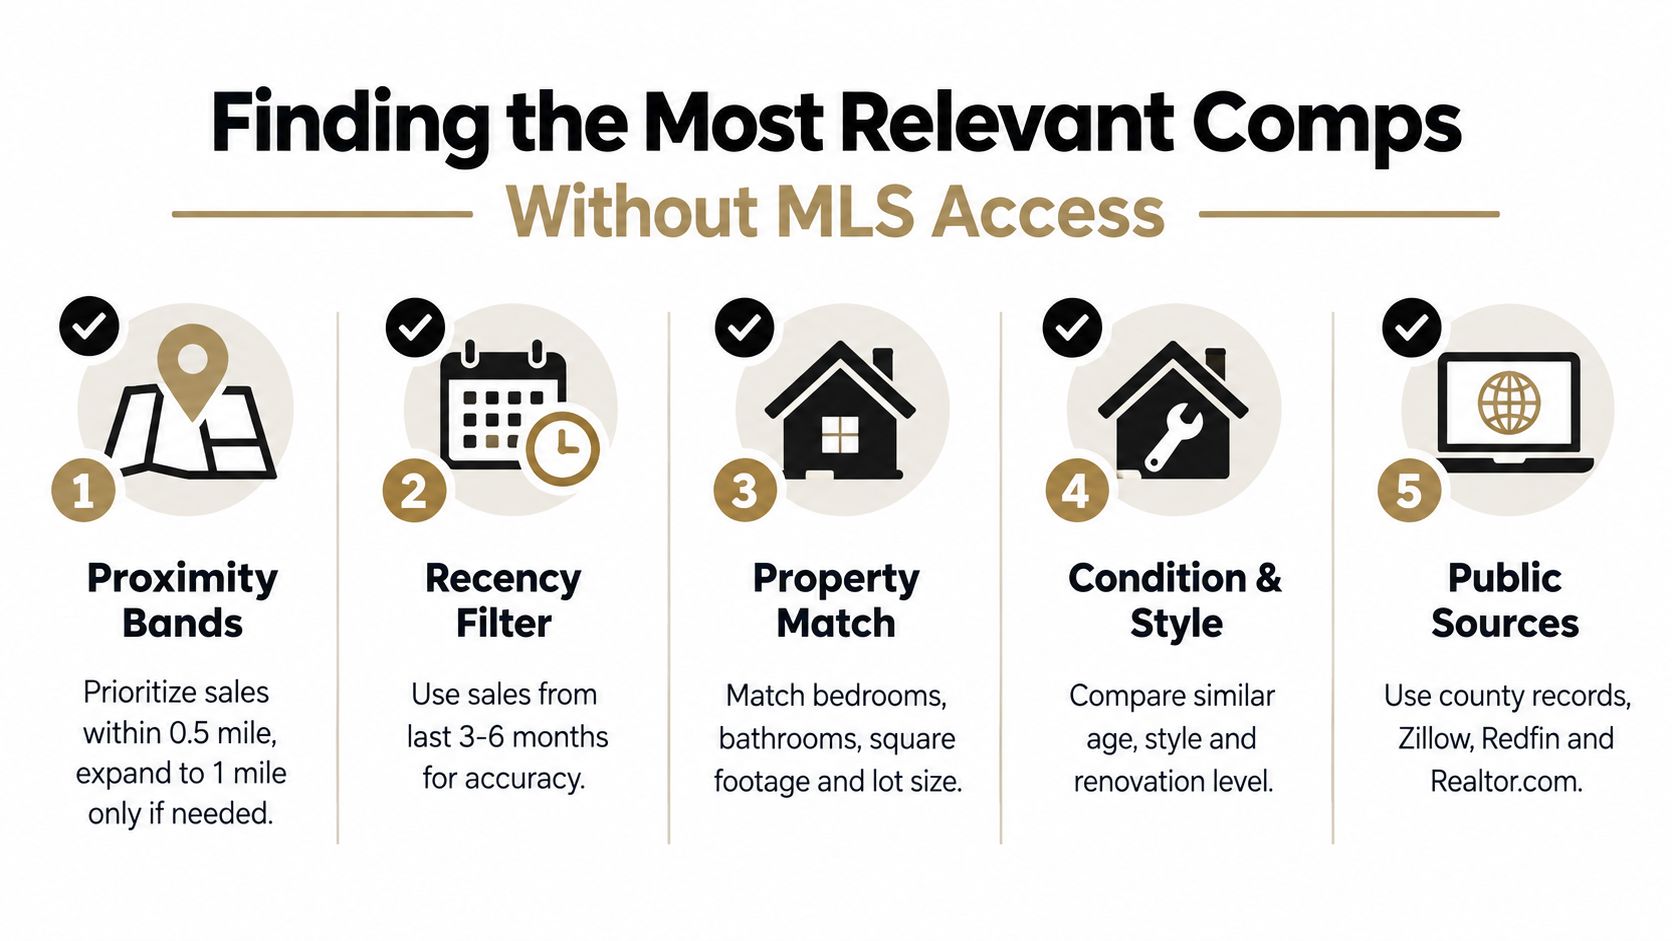
A stale or poorly matched comp can make a renovated property look profitable on paper and overpriced in reality. Start with the buyer's likely search area, then test whether each sale competes for the same buyer. In dense markets, begin with the closest similar closed sales and expand only when the local sample cannot support a credible conclusion. Technical guidance commonly uses three to six closed sales, roughly 0.25 to 1.0 mile in dense markets, up to five miles in rural areas, and sales from the prior three to six months, as outlined in the time-adjustment and comparable-sales reference. Treat those ranges as starting points, not automatic rules. A strong substitute farther away can beat a weak sale next door.
Build the search in layers
Map the immediate competition first. Check the same street, subdivision, school boundary, or recognizable buyer pocket. A property across a major road, railroad, or water feature may compete less directly than an older sale inside the subject's actual market.
Match property type before price. A detached house should not be blended casually with a townhouse, condominium, manufactured home, or multifamily property. Compare bedrooms, bathrooms, living area, lot size, age, architectural style, garage configuration, and functional layout. Square footage cannot correct for a different buyer pool or an inferior floor plan.
Separate condition carefully. A fully renovated sale is not a clean comp for a dated subject unless the renovation difference is measured. Review finish quality, roof and mechanical condition, kitchen and bath updates, floor-plan utility, and outdoor improvements. Cosmetic work and major system replacement do not carry the same value.
Use public records as a starting point, not a final answer
County deed records can confirm the recorded sale date and consideration. Assessor records may provide living area, year built, parcel size, and property classification. Zillow, Redfin, and Realtor.com can add photographs, listing descriptions, price history, and visible condition clues. Public websites may omit concessions, financing terms, repair credits, or the full reason a property sold at its recorded price.
For a faster first pass, property comparables data can organize public-record information before you inspect each candidate. PropLab's comp finder can also narrow sales by property characteristics in a public-data workflow. These tools reduce searching time. They do not replace verification.
A sale belongs in the comp set only after you confirm its terms and competitive relevance. Cross-check listing details against county deed records, review assessor data, contact the listing or selling agent when facts remain unclear, and determine whether the transaction was arm's-length. The practical appraisal verification workflow emphasizes checking multiple records and documenting adjustments. Record concessions separately, because a seller credit can make the headline sale price look stronger than the buyer's effective price.
Reject a candidate quickly when:
- The property type differs: The buyer pool and valuation logic may not match.
- The financing or terms are unusual: Related-party sales, distressed terms, or non-market arrangements can distort price.
- The condition is unclear: “Updated” may mean cosmetic work or a full renovation.
- The sale is stale: Older sales require a defensible market adjustment.
- The location crosses a real boundary: A short map distance can still represent a different competitive area.
If credible sales remain scarce, widen the radius or extend the time window deliberately. Note the reason for each expansion, give newer and more comparable evidence greater influence, and lower your confidence when concessions, condition, or buyer pool remain uncertain. Pricing the uncertainty is safer than treating thin evidence as a precise valuation.
Weighting and Adjusting Comps Like an Appraiser
A stale sale across a neighborhood boundary can produce a cleaner-looking number than a nearby property that sold under unusual terms. Price the evidence, not just the address. A close, recent, physically similar sale should usually carry the most influence, but its weight must reflect market timing, buyer competition, condition, and transaction quality.
Score each comparable against four questions:
- How close is it to the subject and the same buyer pool?
- How recently did it sell relative to the valuation date?
- How closely does its size, layout, condition, and appeal match the subject?
- Are its sale price and concessions representative of an arm's-length transaction?
Distance and recency address different risks. A nearby sale from an earlier market phase may need a meaningful time adjustment. A recent sale from a different submarket may require a location adjustment that is difficult to defend. Give greater weight to the sale buyers would realistically view as a substitute, then reduce confidence when the choice depends on several judgment-heavy corrections.
Make adjustments feature by feature
Adjust the comparable toward the subject. If the comp is superior, subtract the contributory value of that feature from its sale price. If the subject is superior, add value to the comp. Use the buyer's likely reaction, not the contractor's invoice, as the valuation basis.
Common adjustment categories include:
- Living area: Gross living area can create a large numeric adjustment. Use paired sales where possible. Applying a convenient price-per-square-foot figure to every size difference often creates false accuracy.
- Condition: Separate cosmetic updates from structural, mechanical, and functional work. Fresh paint is not equivalent to a new roof, electrical system, HVAC, kitchen, and bathrooms.
- Lot and site utility: A larger lot matters only when buyers pay for usable land, privacy, access, parking, or expansion potential. Excess land without practical utility may add little.
- Amenities: Garages, pools, finished lower levels, accessory units, fireplaces, and outdoor living spaces need support from comparable sales. Their contribution changes with location, price segment, condition, and buyer expectations.
- Market timing: Older sales may require a time adjustment. Support both the direction and size of the adjustment with local evidence. Do not import a broad market assumption into a thin comp set.
Concessions also affect the adjustment. A sale with a substantial seller credit may show a headline price that overstates the buyer's effective cost. Treat the concession as a transaction factor, investigate whether it compensated for repairs or financing, and avoid comparing its gross price directly with a clean sale without considering the difference.
Paired-sales analysis asks a practical question: when two otherwise similar properties differ mainly in one feature, how much did buyers pay for that difference? The answer will not be perfect, but it is more defensible than assigning value because a renovation budget reached a particular amount.
A compact weighting example
The figures below are an illustrative calculation, not a market statistic. The adjusted prices assume that each comp has been reviewed for location, condition, size, transaction validity, and concessions.
| Comp Detail | Adjustment | Weight | Adjusted Price |
|---|---|---|---|
| Close, recent, similar renovated sale | $0 | 40% | $300,000 |
| Nearby sale with smaller living area | +$10,000 | 30% | $290,000 |
| Older sale with inferior condition | +$20,000 | 20% | $285,000 |
| Farther sale in a similar buyer pocket | -$5,000 | 10% | $305,000 |
Multiply each adjusted price by its assigned weight, then add the results. In this illustration, the weighted indication is $293,000. Use that figure as the center of a range, not as a precise truth. The range should widen when adjusted prices are far apart, the evidence is thin, concessions are unclear, or several adjustments rely on judgment.
The adjustment is only as credible as the sale used to derive it.
Record the reason for every adjustment and weight. If you cannot explain why one comp received more influence than another, the model is creating false precision. Assign a confidence score based on similarity, recency, distance, condition clarity, concession quality, and the number of unsupported adjustments. A narrow range fits consistent evidence. A wider range, with a lower confidence score, fits disagreement among the best available sales.
Calculating ARV and Your Max Offer Price With Confidence
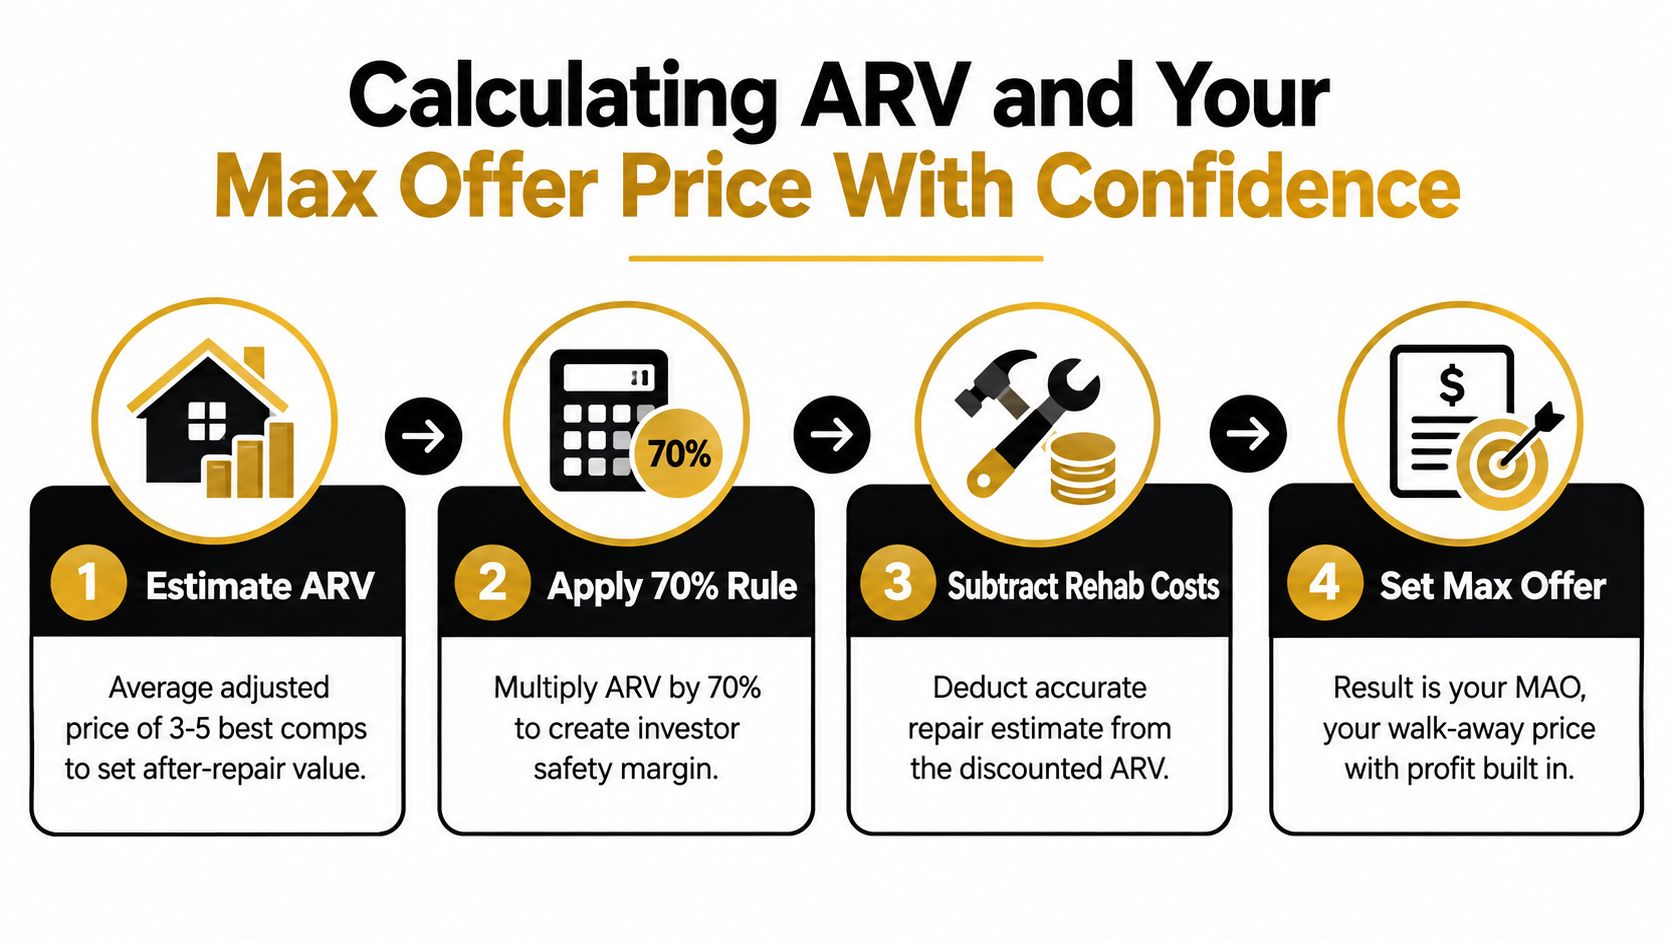
ARV is the expected market value after the work is complete and the property competes with the renovated sales you selected. MAO is the highest purchase price your business can pay after accounting for repairs, selling and holding costs, financing, taxes, transaction expenses, and the profit you require.
A basic investor structure is:
MAO = ARV − rehab costs − holding and selling costs − financing costs − required profit
Some investors use a percentage-based shortcut as an initial screen. The frequently cited 70% rule multiplies ARV by 70% and then subtracts repairs, but it isn't a substitute for a property-specific budget or a comp-confidence assessment. The exact calculation should reflect your capital structure, timeline, resale costs, and risk tolerance.
Work from the adjusted evidence
Suppose your weighted comp analysis supports an illustrative ARV of $293,000. Assume your contractor's current scope indicates $48,000 in rehabilitation costs, and your underwriting assigns $25,000 to holding, selling, and financing costs. If the required profit is $40,000, the maximum purchase price is:
$293,000 − $48,000 − $25,000 − $40,000 = $180,000
That is the offer ceiling under those assumptions. It isn't the listing target, the opening bid, or the number you need to justify emotionally. It's the point above which the projected economics no longer meet the stated requirements.
You can run a shortcut screen as a separate check:
$293,000 × 70% = $205,100
Subtracting the $48,000 rehab estimate produces $157,100. The difference between this shortcut and the more explicit calculation shows why investors need to know what the percentage rule includes or excludes. If the 70% screen is intended to cover selling, financing, holding, and profit, don't subtract those items again. If it isn't, the result can mislead you.
The ARV calculation guide can help organize the inputs, but the judgment still belongs in the assumptions. Tighten your offer when the comp set contains stale sales, unclear concessions, large condition adjustments, or a wide adjusted-price spread. A stronger comp set may support a smaller risk buffer, but it never eliminates execution risk.
Use the conservative end of your ARV range for the offer, not the optimistic midpoint you hope to achieve. If the deal only works at the highest adjusted sale, it doesn't work yet.
Red Flags That Weaken Comps and How to Validate Them
A recent, nearby sale can still be a bad comp. The most overlooked problem is that the recorded sale price may not equal the price the buyer effectively paid after concessions, rate buydowns, repair credits, or builder incentives.
A CFA Institute analysis of housing-market concessions argues that builder concessions can make a recorded price appear materially higher than the resale-clearing price. If those incentives aren't visible in the data feed, the sale can leak into future comparable sets as though the full price represented pure property value. That creates a dangerous feedback loop, especially when an investor uses the comp to justify a resale price.
Validate the transaction, not just the address
Run each important sale through a repeatable review:
- Confirm the deed record: Match the sale date, recorded consideration, parcel, and property identity.
- Inspect the assessor file: Check the classification, size, age, additions, and parcel characteristics.
- Review listing history: Look for price changes, unusual marketing language, extended exposure, and visible condition details.
- Ask about concessions: Contact the agents when possible and record credits, rate buydowns, personal-property transfers, repair allowances, or builder-paid costs.
- Check arm's-length status: Related-party sales, estate transfers, foreclosure-related transactions, and unusual financing may not represent normal market behavior.
- Compare market drift: Look at adjusted sales rather than assuming the latest closing price describes today's value.
Treat scarcity as uncertainty
Thin markets punish false confidence. Recent appraisal commentary says U.S. sales volumes have been running about 30% below normal, leaving appraisers with roughly 30% fewer comps to choose from, according to Appraisal Today's discussion of scarce comps. The impact is greatest in unique properties and less active submarkets, where analysts may rely on older sales, wider search areas, and more adjustment-heavy conclusions.
A confidence score should reflect evidence quality, not decorate a report. High confidence means the sales cluster tightly, the property types align, the transaction terms are understood, and the adjustments are modest. Medium confidence means the conclusion is usable but depends on some judgment. Low confidence means the range is wide, the sales are stale or dissimilar, or the market has too few observations to support a narrow ARV.
You can learn more about structuring that review through data quality assessment. If concessions remain unknown or every plausible comp needs major adjustments, discount the ARV, widen the resale range, or walk away. A lower projected value is cheaper than discovering after purchase that your strongest comp was inflated by terms nobody recorded.

Putting It All Together for Faster Smarter Offers
A repeatable comp process should leave you with five things: a verified sale set, a clear similarity rationale, documented adjustments, a weighted ARV range, and a confidence level that changes your offer. If you can't explain those five items to a partner or lender, you aren't finished underwriting.
Use this decision filter:
- Trust the range: The sales are recent enough, geographically relevant, physically similar, arm's-length, and free from unresolved concession concerns.
- Discount the range: You had to widen distance, extend the time window, mix buyer pockets, or make large condition and size adjustments.
- Walk away or seek better evidence: The valuation depends on one outlier, the transaction terms are unclear, the property is unique, or the margin disappears under a conservative ARV.
The practical advantage comes from consistency. You don't need to rebuild the entire process from scratch for every lead, but you do need to preserve the reasoning behind each number. PropLab pulls public records, tax data, and market signals without requiring MLS access, then organizes relevant sales with distance and recency weighting, adjustment breakdowns, confidence scoring, rehab inputs, and an offer-ready MAO report. Treat the output as an underwriting aid, review the underlying sales, and keep your assumptions visible.
The investor who wins consistently isn't the one who finds a convenient comp fastest. It's the one who recognizes when a sale is useful, when it needs a discount, and when the evidence isn't strong enough to risk capital.
Use PropLab to screen your next property with verified public-data comps, weighted ARV analysis, rehab estimates, confidence scoring, and a clear MAO. Visit PropLab before you make the offer, and turn your comp review into a documented decision instead of a guess.
About the Author
P
PropLab Team
Real Estate Analysis Experts
The PropLab team consists of experienced real estate investors, data scientists, and software engineers dedicated to helping investors make smarter decisions with AI-powered analysis tools.
Free tool
Pull comps for any address
Comparable sales with adjustments, ready to defend in front of a seller or a lender.
