General
Supply Demand Analysis for Real Estate Investors
September 21, 2026
18 min read

You're probably looking at a deal right now that works on paper and still doesn't feel safe.
The comps line up. The rehab scope looks ordinary. The margin passes your quick test. But you also know the part that blows up flips usually isn't the paint budget or the flooring bid. It's the exit. A house that should resell fast drags. Showings are thin. The first weekend is quiet. Then the price cut starts eating the profit you thought was locked in.
That's where supply demand analysis stops being an economics term and becomes an underwriting filter. For investors, it isn't about drawing two curves on a chart. It's about figuring out how much confidence you should have in your ARV, how aggressive your MAO can be, and whether the rehab plan matches the actual buyer depth in that submarket.
Why Two Identical Deals Pay Very Differently
I've seen this setup more than once. Two houses look almost interchangeable in a spreadsheet.
Both are average three-bedroom flips in B-class areas. Both have comp support near the same resale number. Both need straightforward work, not a gut job. If you only underwrite from sold comps and a rehab line item, they look close enough to treat the same.
Then one sells almost immediately and the other turns into a carry-cost problem.
The spreadsheet isn't the difference
The first house gets traffic right away because buyers in that pocket are already waiting on limited resale inventory. Agents know what's scarce. Lenders know the zip is liquid. Buyers stretch on terms because they've already lost on other homes.
The second house can appraise similarly and still be a worse investment. If active listings are stacking up, pendings are thin, and similar homes are lingering, your comp sheet gives you a theoretical value while the market gives you a slower, weaker exit.
Supply demand analysis matters most when two deals look the same at acquisition but behave differently at resale.
That's why I care more about local market temperature than broad city headlines. Days on market, how many active competitors are sitting near my target resale price, and how quickly listings convert to pending will tell me more about my likely profit than another decimal place in a renovation estimate.
What changes in the real world
When demand is deep relative to supply, I can trust my exit more. I may still buy conservatively, but I won't automatically assume the resale needs every upgrade in the catalog. Buyers in a tighter submarket often reward speed, clean condition, and correct pricing more than expensive over-improvement.
When supply starts outrunning demand, the exact opposite happens:
- ARV gets softer: The highest closed comp becomes less dependable if current actives are sitting.
- Hold time expands: Longer exposure means more carrying cost and more chances that the next comp closes lower.
- Negotiation power shifts: Buyers ask for credits, pick at inspection items, and wait to see who blinks.
A lot of investors make this mistake when picking the right investment city. They choose the market from a macro story, then underwrite a specific zip as if all neighborhoods inside that city absorb homes the same way. They don't.
Two “good” deals can pay very differently because one exits into scarcity and the other exits into competition. That difference is what supply demand analysis is supposed to catch before you send the offer.
What Supply Demand Analysis Really Means for Investors
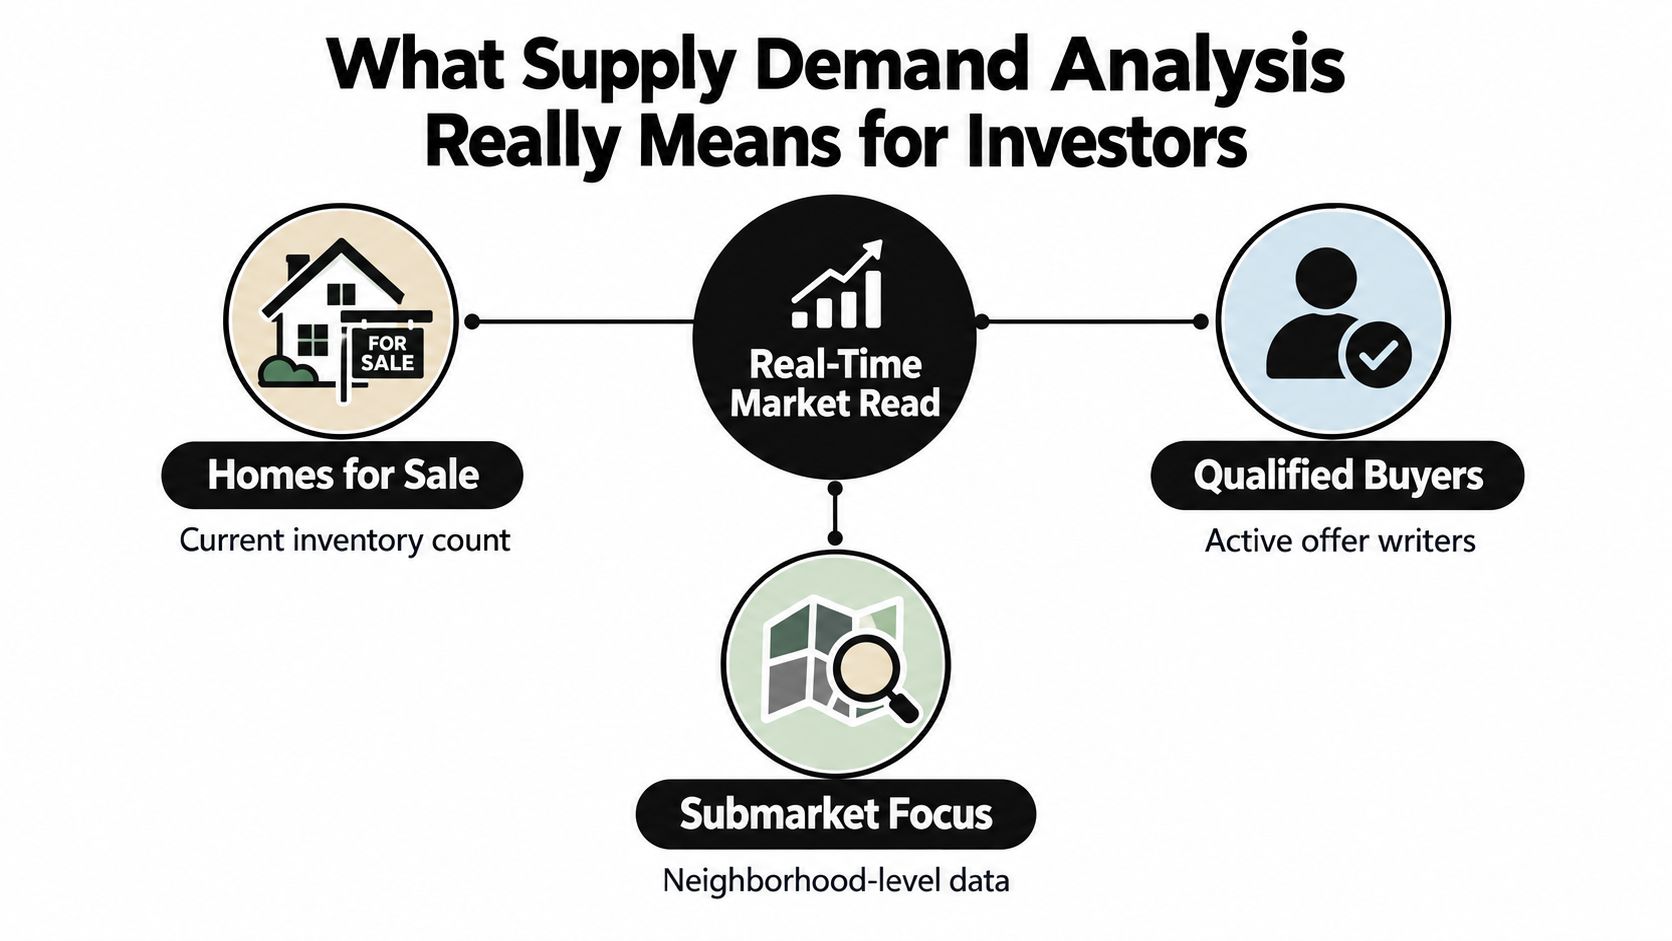
For investors, supply demand analysis is a live read on resale pressure in a very specific market. Not a metro. Not a county. Usually a price band inside a neighborhood or zip.
You're asking one basic question: how many homes are competing for the same buyers, and how fast are those buyers absorbing them?
The investor version of equilibrium
Economics has used supply and demand as a formal market framework since the start of the twentieth century, and the core idea still holds: market equilibrium sits where quantity demanded equals quantity supplied, which is why the model is still used to interpret price changes, shortages, and surpluses across markets (historical overview from Queen Mary University of London). In plain real estate terms, prices usually rise when demand exceeds supply and fall when supply exceeds demand, with equilibrium where the two meet (market equilibrium summary from FSCJ Pressbooks).
That sounds academic until you translate it into acquisition decisions.
In housing, investors usually use months of supply as the headline gauge. Think of it as a rough answer to this question: if no new listings came on, how long would it take the market to clear what's available at the current sales pace?
How it changes your underwriting
A practical read many investors use is this:
- Tight supply: Sellers have more power. Good resales clear fast, and the ARV range tends to be more dependable.
- Balanced supply: Buyers and sellers are closer to even. You need clean comp selection and realistic finish choices.
- Heavy supply: Buyers gain power. Your spread has to absorb slower movement, more competition, and more pricing risk.
The number itself matters less than what it does to your assumptions. A low-supply pocket can support a fuller rehab scope because there's enough buyer depth to reward the finished product. A high-supply pocket pushes me the other way. I trim ARV confidence, lower MAO, and widen my timeline.
Practical rule: Don't treat ARV like a fixed output. Treat it like a confidence range that gets tighter or wider based on supply and demand.
Absorption is the bridge metric
A lot of investors stop at inventory count. That's not enough.
A zip with more listings can still be stronger than a smaller one if homes are being absorbed faster. That's why absorption rate matters. It connects active supply to actual buyer action. If homes are consistently moving from active to pending without sitting, the market can digest more inventory than the raw count suggests.
That's the whole point of supply demand analysis in underwriting. It tells you whether your resale assumption is backed by active buyer behavior or just by old sold comps.
The Metrics and Data Sources That Move Your Underwriting
Most market reports are too busy to be useful. They give you a pile of charts, then leave you to guess what changes your offer.
Before I send a number, I want a short list of metrics that affect exit certainty. Some are leading indicators. Some lag. Together they tell you whether demand is strengthening, fading, or being overstated by stale sales data.
The short list that actually matters
| Key Supply-Demand Metrics for Investor Underwriting | What It Tells You | Primary Data Source |
|---|---|---|
| Months of supply | Whether current inventory is tight, balanced, or heavy relative to sales pace | MLS feeds, brokerage market centers |
| Median days on market | How long similar homes take to attract an acceptable buyer | MLS feeds |
| List-to-sale price ratio | How much negotiating power buyers or sellers have near your target resale band | MLS feeds, title-close data |
| Price-cut share | Whether sellers are chasing the market down to meet weaker demand | MLS feeds, brokerage trend reports |
| New listings versus pending sales | Whether fresh supply is being absorbed or backing up | MLS feeds |
| Building permits pulled | Whether more future competition is likely to hit the submarket | Local permit office, county planning records |
| Distressed inventory share | Whether forced sellers may pressure pricing and comp quality | County recorder, foreclosure tracking services, local distress reports |
| Mortgage fallout and buyer financing friction | Whether deals are failing after contract because buyers can't close cleanly | Local agent feedback, lender relationships, transaction-level data |
Which ones lead and which ones lag
Closed sales are useful, but they tell you where the market has been. If you're buying a flip today, you need signals that move earlier.
Leading indicators include new listings, pending activity, permit volume, and financing fallout. These help you catch changing pressure before it fully shows up in sold comps.
Lagging indicators include closed-sale pricing and broad median price trends. They matter, but they can make a softening market look healthy for longer than it really is.
That's why I like pairing one activity metric with one pricing metric. If actives are rising and price cuts are spreading, I don't need to wait for lower closed comps to know my resale assumptions deserve more caution.
Where investors usually pull the data
You don't need one magical dashboard. You need a repeatable stack.
- MLS and brokerage feeds: Best for inventory, pendings, days on market, and price-cut behavior.
- County and municipal records: Useful for permits, ownership history, and distressed filings.
- Transaction datasets: Good for confirming sale patterns without relying on listing-side presentation.
- Comping and underwriting tools: Helpful when they show how the comp set was built instead of just spitting out a number.
For transaction-side context, this breakdown of property transaction data is worth reviewing because it highlights where public records help and where they can lag the market.
If you can't identify which metrics are early warnings and which are rear-view mirrors, you're not doing supply demand analysis. You're reading a summary after the move already happened.
One practical workflow is to line these inputs up in a single panel: current inventory, pending pace, recent price reductions, permit pipeline, and distressed activity around the same resale band as your intended exit. That's enough to tell you whether your comp-backed ARV deserves confidence or skepticism.
Running the Analysis in Hot, Cooling, and Oversupplied Markets
The checklist doesn't change much from market to market. What changes is the pattern.
A hot market, a cooling market, and an oversupplied market can all produce decent deals. But they don't reward the same buy box, and they definitely don't justify the same resale assumptions.
What hot looks like in practice
In a hot pocket, listings don't sit long unless they're overpriced or flawed. Pending activity absorbs new supply quickly. Buyers compete for the same clean inventory, and resale confidence is usually highest when your finish level matches the local standard instead of trying to exceed it.
The danger in a hot market isn't weak demand. It's acquisition discipline. Investors get comfortable paying up because they assume speed will bail them out.
What cooling feels like before the headlines catch up
Cooling markets are trickier because they still produce comps that look healthy. The shift shows up first in softer negotiating posture, more selective buyers, and listings that need a second or third weekend to get traction.
Live trend tools can help if you use them correctly. A feed like the live Redfin market data API can be useful for watching current inventory and market movement at a more granular level, but it still needs to be read against your exact price band and comp set.
In a cooling market, the best comp on paper is often the least relevant comp for underwriting today's exit.
When oversupply changes the whole deal shape
Oversupplied markets don't just lower prices. They change buyer behavior. Buyers wait. Sellers compete on concessions. New deliveries can crowd resale product, especially if your flip lands beside fresher inventory with builder incentives attached.
HUD reported that new-home inventory in the first quarter of 2025 supported 9.1 months of sales, up from 8.1 months a year earlier, which shows a slower-absorbing new-home environment in the near term (HUD national housing market summary). That doesn't mean every local market is weak. It means you can't underwrite on a blanket shortage story and ignore local absorption.
| Supply-Demand Metric Behavior by Market State | Hot Market | Cooling Market | Oversupplied Market |
|---|---|---|---|
| Months of supply | Tight and quickly cleared | Rising or uneven across submarkets | Heavy relative to current sales pace |
| Days on market | Short exposure for well-priced homes | Longer marketing windows start showing up | Listings sit unless sharply priced |
| List-to-sale ratio | Sellers hold more leverage | Negotiation widens | Buyers push for discounts and credits |
| Price-cut behavior | Limited on correctly priced homes | More common as sellers test pricing | Frequent and often necessary |
| New listings versus pendings | Pendings keep up with fresh supply | Fresh supply starts to outpace absorption | Inventory stacks faster than buyers absorb |
| Permit and delivery pressure | Future competition matters but may still be absorbed | Pipeline becomes a watch item | New deliveries can directly pressure your exit |
| Distress signal | Usually muted in stronger segments | Needs close monitoring | Can alter comp quality and buyer perception |
If you run the same checklist every time, market state becomes clearer. What changes next is how aggressively you convert those signals into your offer and renovation plan.
Turning Market Signals Into ARV, MAO, and Rehab Decisions
Most investors either get sharp or stay theoretical.
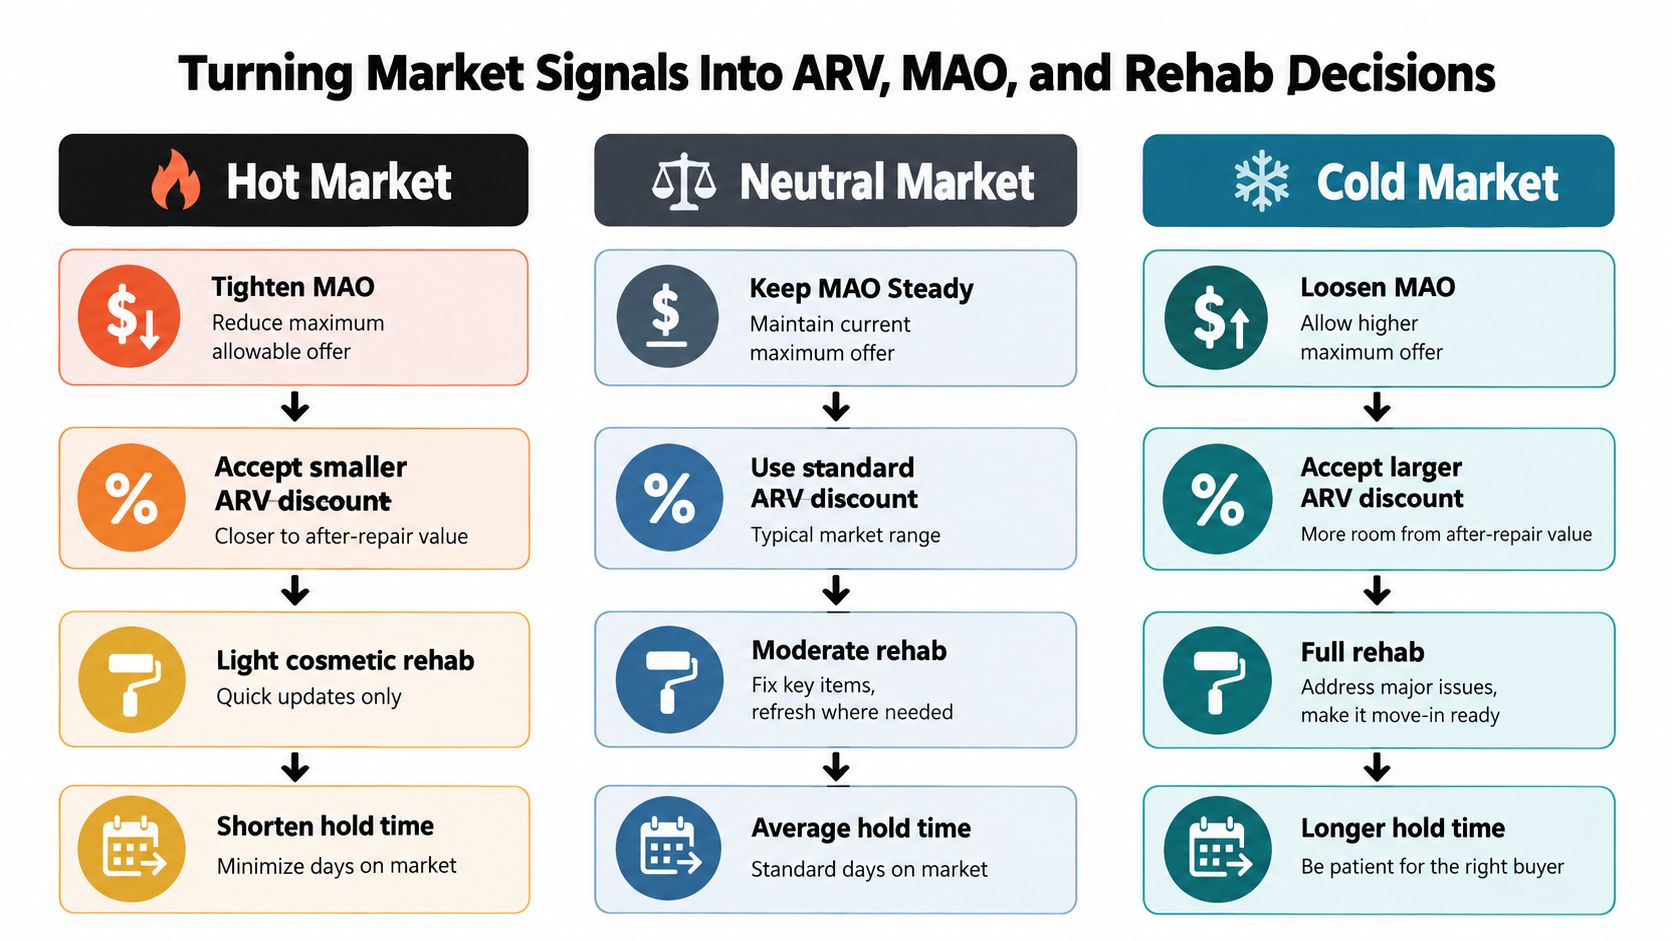
Reading supply and demand well is only useful if it changes your numbers. The point isn't to sound informed. The point is to decide whether your ARV should be trusted, discounted, or treated as a stretch case.
Start with ARV confidence, not ARV optimism
In a tighter market, I'm usually more willing to lean on the upper half of a comp range if actives and pendings support it. That doesn't mean overpaying. It means the resale has real buyer depth behind it.
In a softer market, I mark down confidence before I mark down the property. A house may still be worth the target number under perfect conditions, but underwriting has to price in friction. That usually means using a more conservative comp set, assuming a longer sale process, and refusing to underwrite from one standout sale.
Then adjust MAO to match the exit risk
Your maximum allowable offer should move when the market changes, even if the house doesn't.
Here's the practical translation:
- Hot market: You may accept a narrower spread to win a quality asset, especially if nearby resales are clearing quickly and buyers aren't demanding much at inspection.
- Balanced market: Standard buy criteria still work, but only if your comp set is tight and your rehab matches neighborhood expectations.
- Oversupplied market: Widen the discount you require. Build in more room for slower absorption, more concessions, and a weaker final comp set by the time you list.
One clean workflow is to run comps, lock a baseline ARV, then stress-test that value under multiple absorption scenarios before finalizing the offer. PropLab does this in a practical way by combining public records, tax data, comp weighting, ARV confidence scoring, rehab estimates, and an MAO output in one underwriting flow.
Rehab scope should follow buyer depth
This part gets missed all the time. Investors over-rehab in weak markets and under-rehab in selective ones.
In a stronger demand environment, a lighter cosmetic plan can work because buyers are prioritizing availability and acceptable condition. In a slower market, the house often needs sharper positioning to beat competing inventory. That doesn't mean spending blindly. It means spending where the buyer notices the difference and skipping vanity upgrades that don't improve resale liquidity.
Field note: Rehab scope should solve buyer objections, not satisfy investor pride.
A simple decision sequence works well:
- Confirm the likely buyer pool: First-time owner-occupant, move-up buyer, or investor.
- Match finish level to nearby winners: Not the fanciest listing. The listings that went pending.
- Price the exit under at least three conditions: strong absorption, normal absorption, and slow absorption.
- **Send the offer only after the downside case still works.
When investors say a deal “stopped working,” it's usually because they treated supply demand analysis as commentary instead of using it to reshape ARV, MAO, and scope before going under contract.
Where Most Investors Misread the Market
The biggest mistake I see is treating supply as one citywide number.
That's too blunt for flips. A market can have more listings overall and still be brutally tight in the exact resale band you need. If your exit depends on buyers looking for affordable, financeable homes, broad inventory growth may not help you much at all.
More supply doesn't always mean easier exits
A major blind spot in real estate coverage is concentration. The question isn't just whether inventory exists. It's where the shortage or surplus sits by affordability band and household type.
The National Association of Realtors found that a balanced market would give moderate-income buyers access to only about 48.1% of listings, implying a shortage of roughly 416,000 listings priced at or below $255,000. The same affordability work notes that the United States was still short by 4.03 million homes in 2025, including 1.8 million missing Gen Z and millennial households tied to affordability and structural barriers (NAR housing affordability and supply research).
For investors, the lesson is straightforward. “More supply” is not the same as “the right supply.”
Read the submarket, not the headline
If your flip is aimed at entry-level owner-occupants, you need to know whether buyers in that band have choices. If not, your resale may still be liquid even while higher-priced inventory is backing up.
That's also why comp selection gets messy fast when the data is dirty or too broad. Pulling a city average into a narrow resale decision can hide the actual buyer pool you'll depend on. A tighter process for data quality assessment matters, because bad categorization and loose comp matching can make a thin market look deeper than it is.
Investors who read the market well don't just ask, “Is inventory up?” They ask:
- Which price band is tight?
- Who can still qualify and close?
- Which listings are competing for my exact buyer?
- Are my comps drawing from the same affordability lane as my resale?
Those answers drive resale liquidity a lot more than citywide headlines.
Limitations, Red Flags, and Your Pre-Offer Checklist
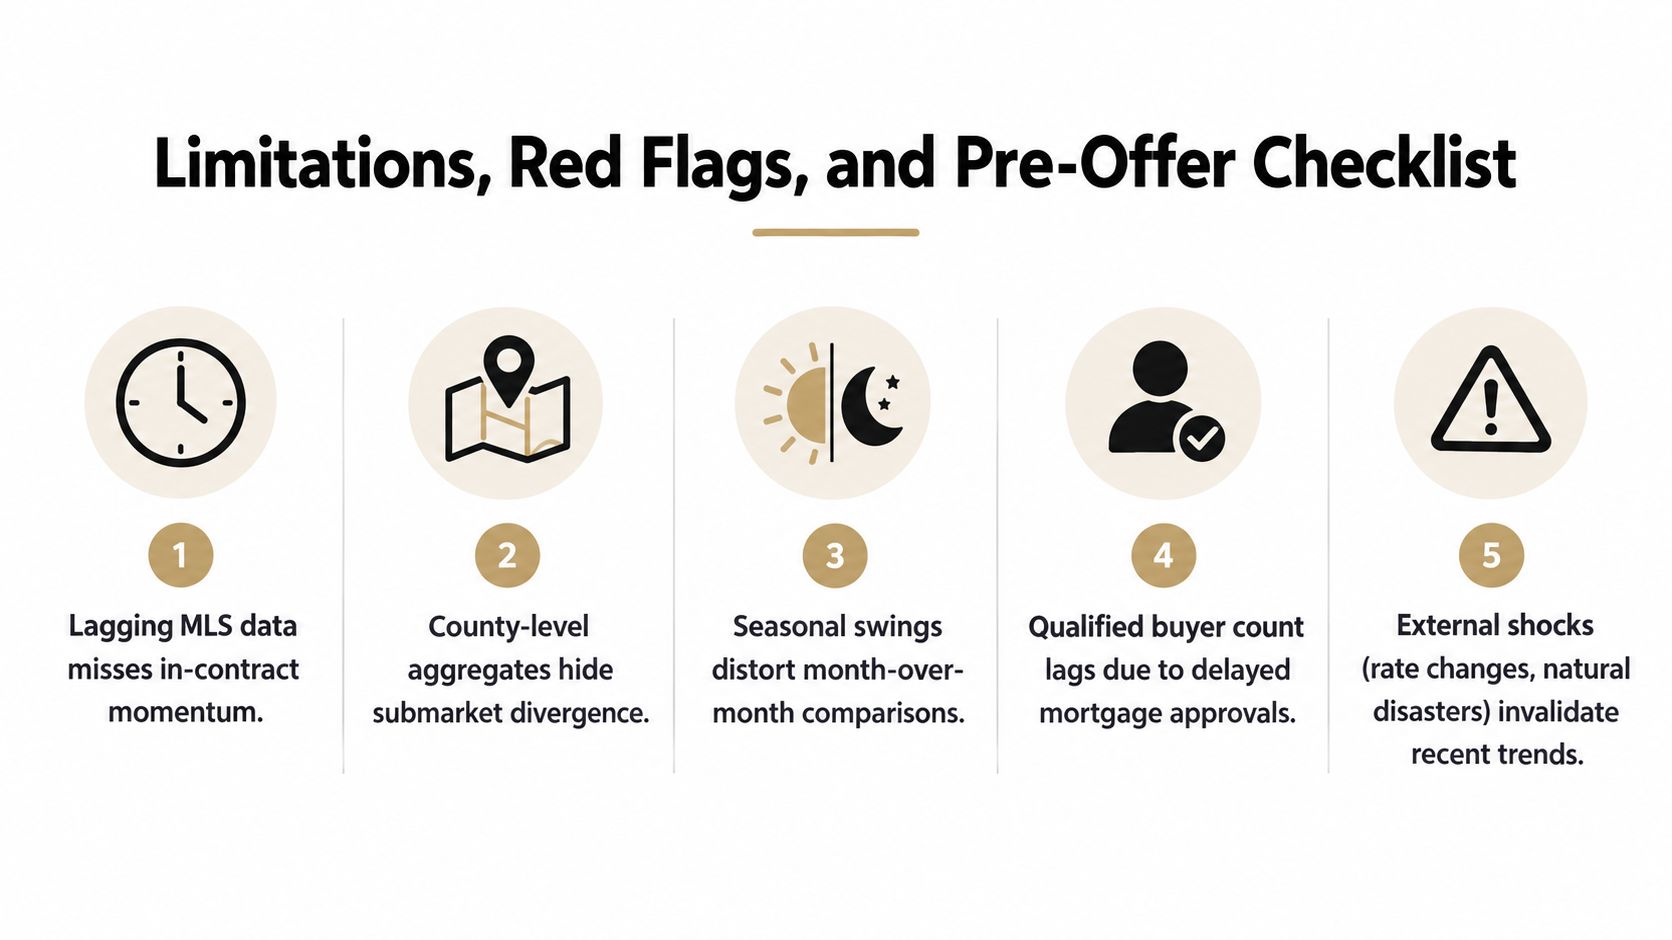
Supply demand analysis is useful, but it has blind spots. If you forget that, you'll trust the signal too much and miss the setup changing underneath you.
MLS data can lag what's happening in-contract. County-level summaries can hide one neighborhood running hot while the next one stalls. Seasonal shifts can distort month-to-month reads, especially if you're looking at a thin sample. And sometimes macro events override local patterns. Rate moves, layoffs, insurance shocks, and lending pullbacks can hit before the comps fully reflect them.
Red flags that deserve a second pass
I slow down when I see combinations that don't fit the headline story.
- Inventory rising while listings still move quickly: That can mean shadow supply is building but hasn't hit pricing yet.
- Price reductions spreading while broad supply looks healthy: Sellers may already be chasing weaker demand.
- Permit activity looking harmless on paper: Future competition can arrive later than expected and still pressure your exit.
- Distress rising in one pocket: Forced sales can distort comp quality and buyer perception at the same time.
The pre-offer discipline that saves money
Use a simple checklist before you lock your number.
- Check freshness: Confirm the market data you're relying on is recent enough to matter.
- Cross-check signals: Don't trust one metric by itself. Pair activity with pricing pressure.
- Validate the comp lane: Use comps from the same affordability and buyer segment as your likely resale.
- Stress the downside: Run the deal with an ARV haircut and make sure it still clears your standards.
- Confirm buyer depth: Ask whether enough likely buyers exist for your exact finish level and price point.
A broader real estate due diligence checklist helps because supply demand analysis should sit inside a larger acquisition process, not replace it.
The investors who stay out of trouble usually aren't the ones with the fanciest model. They're the ones who respect what the market is saying before they need a price cut to hear it.
If you want a faster way to turn market signals into an offer-ready decision, PropLab gives you ARV estimates, rehab cost analysis, MAO calculations, comp support, and risk flags in one workflow. It's built for the exact problem this article covers: deciding whether a deal still works after you factor in real resale pressure instead of just trusting the spreadsheet.
About the Author
P
PropLab Team
Real Estate Analysis Experts
The PropLab team consists of experienced real estate investors, data scientists, and software engineers dedicated to helping investors make smarter decisions with AI-powered analysis tools.
Free tool
Get the ARV of any property in 30 seconds
Skip the spreadsheet. Enter an address and get an after-repair value backed by real comps.
