General
Cash on Cash Return Example: Formula and Math
November 20, 2026
13 min read
You're reviewing a rental listing, and the projected rent looks promising. But the cash you'll need isn't just the down payment. There are closing costs, repairs before a tenant can move in, and money you'll want available when something breaks. Before making an offer, you need to know what all that cash could earn.
A useful cash on cash return example follows the money in both directions: what you put into the property and what you receive after expenses and loan payments. The arithmetic is simple. Choosing the right inputs takes more care.
What Cash on Cash Return Measures
Cash on cash return measures annual pre-tax cash flow against the investor's total cash invested. Think of it as the cash yield on the money you handed over, rather than on the property's entire purchase price.
Cash on cash return = Annual pre-tax cash flow ÷ Total cash invested × 100
The Wikipedia explanation of cash on cash return illustrates the distinction with a $1,200,000 apartment complex purchased using $300,000 of equity. After operating expenses, the property produces $5,000 per month, or $60,000 annually, before mortgage payments. Dividing that income by the equity produces 20%, but that calculation hasn't accounted for financing.
Once mortgage payments of $2,000 per month, or $24,000 annually, are deducted, the investor receives $36,000 in annual pre-tax cash flow. The cash-on-cash calculation becomes $36,000 ÷ $300,000 × 100 = 12%.
Separate the building's income from your income
Property-level income describes operating performance before financing. Equity-level cash flow describes what remains for the investor after debt payments. Confusing them can make a financed acquisition look more profitable than its actual cash distributions support.
For another plain-language treatment, Global's guide to cash on cash returns for investors provides useful context. Our explanation of cap rate versus cash on cash return helps distinguish the property's operating yield from the investor's financing-dependent yield.
Use this metric to assess current cash generation, particularly when comparing similarly financed opportunities. Don't treat it as a complete investment return: appreciation, principal paydown, depreciation benefits, refinancing proceeds, eventual sale profits, and personal income taxes sit outside the standard annual pre-tax calculation.
How to Calculate Cash on Cash Return Step by Step
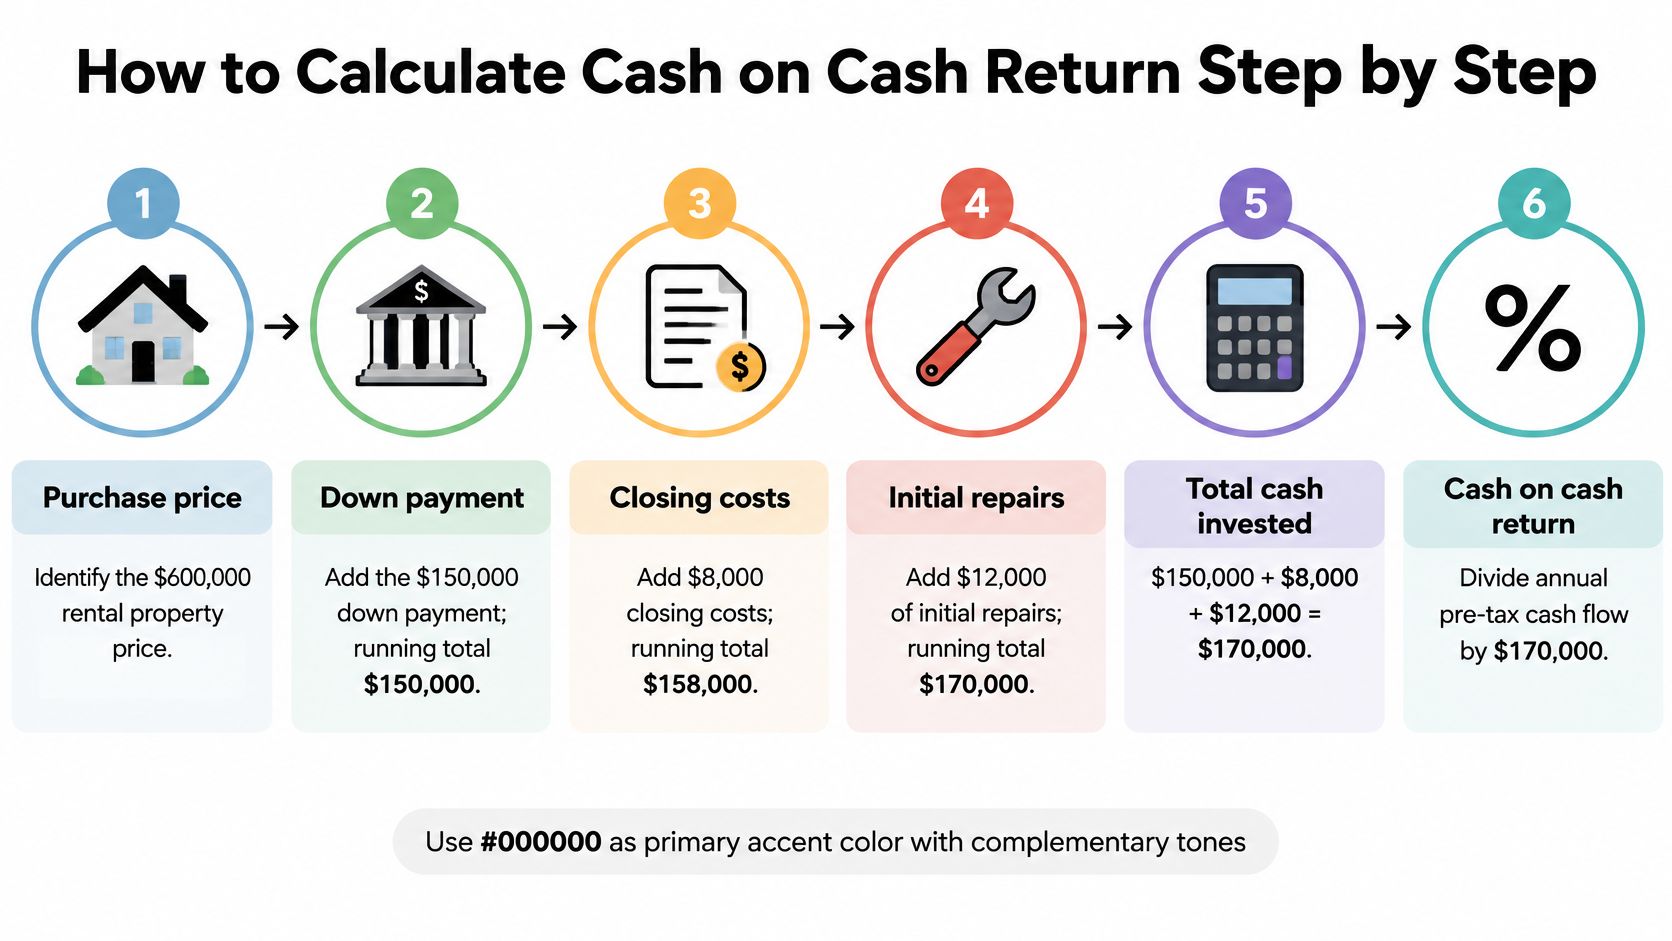
For a complete rental example, Wiss's cash-on-cash calculation guide uses a $600,000 property, with $150,000 down, $8,000 in closing costs, and $12,000 in initial repairs. Its operating assumptions lead to $7,500 in annual pre-tax cash flow and a 4.4% cash-on-cash return.
The visual below shows how the acquisition cash adds up before you calculate the yield.
Work from cash contributed to cash received
Add your initial cash contributions.
Down payment plus closing costs plus initial repairs gives $150,000 + $8,000 + $12,000 = $170,000 invested. Include any additional funded reserves in a real deal, but don't invent a reserve contribution in this example. The common mistake is stopping at the down payment.Use income after vacancy.
The example's first-year effective gross income is $52,000. That's the running income figure after vacancy, not the rent you'd collect if every unit stayed occupied and every tenant paid. Don't subtract vacancy again if your starting figure already includes it.Deduct operating expenses.
Subtract $18,000 for operating costs to reach $34,000 in net operating income, or NOI. Typical categories include property taxes, insurance, management, and maintenance. Keep mortgage payments out of this line so you don't confuse operations with financing.Subtract annual debt service.
Deduct $26,500, leaving $7,500 in pre-tax cash flow. Include the scheduled principal and interest payments, not interest alone. If you're still awaiting a lender quote, use a mortgage calculator with the proposed loan amount, rate, and amortization, then annualize the monthly payment.Divide cash flow by cash invested.
The calculation is $7,500 ÷ $170,000, producing approximately 0.044. Don't divide by the property's purchase price, which answers a different question.Convert the decimal to a percentage.
Multiply by 100 to report 4.4%, rounded. Keep the underlying spreadsheet calculation unrounded so later comparisons remain accurate.
The video offers another way to follow the calculation.
Whether this result meets your needs depends on your required cash income, the reliability of the assumptions, and the alternatives available for the same capital. Set your target before reviewing the final percentage, rather than adjusting your expectations to make a listing work.
Which Costs Belong in Total Cash Invested
The denominator can change your decision without changing the property's income. Holding annual cash flow constant, you can make a deal appear stronger by leaving out money you contributed.
Same rental, three cash invested denominators
| Denominator | Cash invested | Pre-tax cash flow | Cash-on-cash return |
|---|---|---|---|
| Down payment only | $150,000 | $7,500 | 5.0% |
| Down payment plus closing costs | $158,000 | $7,500 | 4.7% |
| Fully loaded cash invested | $170,000 | $7,500 | 4.4% |
The middle row is calculated by adding closing costs to the down payment and dividing the unchanged cash flow by that larger contribution. Nothing improved or deteriorated operationally. You've become more complete about the cash committed.
Lev's guide to cash on cash return identifies acquisition, financing, renovation, and pre-rent holding costs as important parts of the investment calculation. Organize your cash ledger into practical groups:
- Acquisition and financing: Closing charges, lender points, inspections, and other investor-paid transaction costs.
- Preparation: Initial repairs, renovations, permits, and work required before the property can generate the expected rent.
- Pre-rent carrying costs: Interest, property taxes, insurance, and utilities during renovation or lease-up.
- Committed reserves: Cash set aside for contingencies and operating shortfalls. Identify it separately from spent costs so readers can see what remains available.
Track money returned without rewriting history
For value-add and BRRRR deals, keep a dated record of cash contributed and cash returned. A lender draw that reimburses an investor-funded renovation reduces cash still tied up; a draw paid directly to a contractor isn't an additional personal contribution. Seller credits reduce the costs you fund, subject to how the closing statement applies them.
Refinancing requires another distinction. You can retain the original investment denominator for an acquisition-period comparison or calculate a post-refinance yield on cash remaining, but label the method and use the corresponding debt payments. Don't present borrowed refinance proceeds as recurring rental income.
Practical rule: Make the purchase decision using fully loaded cash invested. Show narrower denominators only as context, not as competing versions of the truth.
This matters especially when an otherwise acceptable projection falls below your target after carrying costs and contingency cash are included.
Annual Cash Flow Example for a Commercial Property
Suppose you're underwriting a commercial acquisition. The example described by Investopedia's cash-on-cash return guide uses a $2,000,000 purchase, funded with a $400,000 down payment, $25,000 in closing costs, and $25,000 in initial upgrades. That makes total cash invested $450,000.
Read the operating statement from top to bottom. Each deduction answers a different question about where the rent goes.
First-year cash flow for a $2,000,000 commercial property
| Line item | Amount | Running result |
|---|---|---|
| Rental income | $180,000 | $180,000 |
| Vacancy loss | -$20,000 | $160,000 |
| Operating expenses | -$50,000 | $110,000 NOI |
| Debt service | -$60,000 | $50,000 pre-tax cash flow |
| Total cash invested | $450,000 ($400,000 down, $25,000 closing, $25,000 upgrades) | Denominator |
| Cash-on-cash return | $50,000 ÷ $450,000 | 11.1% |
Vacancy comes off the top because scheduled rent isn't the same as income available to pay bills. Empty space and uncollected rent reduce the operating income you can actually rely on.
Operating expenses then account for running the building. Depending on the leases, those expenses can include landlord-paid taxes, insurance, maintenance, management, and utilities. Review tenant reimbursements carefully so you don't deduct an expense without recognizing the corresponding reimbursement, or assume tenants cover costs the lease leaves with you.
Debt service follows NOI because the mortgage belongs to the financing structure, not the property's operating performance. The final cash-flow line is what supports the investor's annual cash yield.
Check the documents behind the projection
Build your own version from a current rent roll, executed leases, an operating statement, and the lender's proposed payment schedule. Our guide to rental property financial analysis provides a broader framework for organizing those inputs.
Before trusting the first-year result, check:
- Lease timing: Confirm expirations, concessions, rent steps, and when vacant space is expected to begin paying.
- Expense completeness: Identify deferred maintenance and costs omitted from the seller's presentation.
- Period consistency: Don't combine stabilized future rent with renovation-period expenses and call it the actual acquisition year.
For a Puerto Rico acquisition, keep tax-program questions separate from this pre-tax worksheet. Christie's International Real Estate Puerto Rico's Act 60 frequently asked questions can help you identify issues to discuss with a qualified adviser without assuming that a potential tax benefit belongs in operating cash flow.
The resulting yield is an example of the method, not a universal commercial-property benchmark. Another buyer's down payment, loan structure, or upfront improvement budget could produce a different result for the same building.
How Leverage Changes Your Cash on Cash Return
Financing can increase the return percentage while reducing the cash you receive. The explanation isn't better rent collection or lower maintenance costs. It's a smaller equity denominator.
CoreVest's financing illustration uses a $200,000 property generating $18,000 in annual NOI. With 75% loan-to-value financing, the investor contributes $50,000 and borrows $150,000; an illustrative 7% rate and 30-year amortization produce approximately $11,975 in annual principal-and-interest payments.
For a larger comparison, JPMorgan Chase's cash-on-cash example uses $2,000,000 in equity, $4,000,000 in debt, $400,000 in NOI, and $200,000 in annual debt service, producing a 10% return. The all-cash row below is calculated from that same property income and total acquisition funding.
All-cash versus financed cash on cash return
| Scenario | Investor equity | Annual pre-tax cash flow | Cash-on-cash return |
|---|---|---|---|
| $200,000 property, all cash | $200,000 | $18,000 | 9.00% |
| Same property, 75% loan | $50,000 | About $6,025 | About 12.05% |
| $6,000,000 property, all cash | $6,000,000 | $400,000 | 6.7% |
| Same property, $200,000 annual debt service | $2,000,000 | $200,000 | 10% |
Read the percentage alongside the dollars
In both comparisons, debt payments reduce annual distributable cash. The reported yield rises because the equity contribution falls proportionately more than cash flow does. These simplified financing comparisons isolate borrowing effects; a real acquisition should also account for its transaction costs and required reserves.
That distinction matters when you're choosing between income amount and capital efficiency. An investor who needs dependable cash distributions might prefer a different structure from an investor trying to preserve capital for another acquisition.
A higher percentage doesn't necessarily mean more spendable cash or a more profitable building.
Debt also introduces payment obligations during vacancy, possible refinancing exposure, rate risk where applicable, and default risk. Pair the yield with an assessment of debt service coverage ratio, rather than assuming that a higher return using borrowed funds means the loan is comfortably supported.
Show operating performance without debt and cash yield with debt side by side. Then test rent, occupancy, expenses, and debt payments together so you can see whether the financing still works when operations weaken.
Where Cash on Cash Return Misleads and How to Test It
The most dangerous assumption is that a precise percentage means a reliable forecast. A spreadsheet can calculate an exact answer from uncertain rent, incomplete expenses, and a loan payment the lender hasn't approved.
Shining Star Funding's explanation emphasizes the importance of financing terms, total cash invested, and sensitivity testing. Cap rate evaluates property income before financing; cash on cash return evaluates income relative to the investor's cash contribution after financing. Use the former to help separate the asset from the capital structure, then use the latter to assess your proposed investment.
The checklist below connects the metric's exclusions with the additional analysis they require.
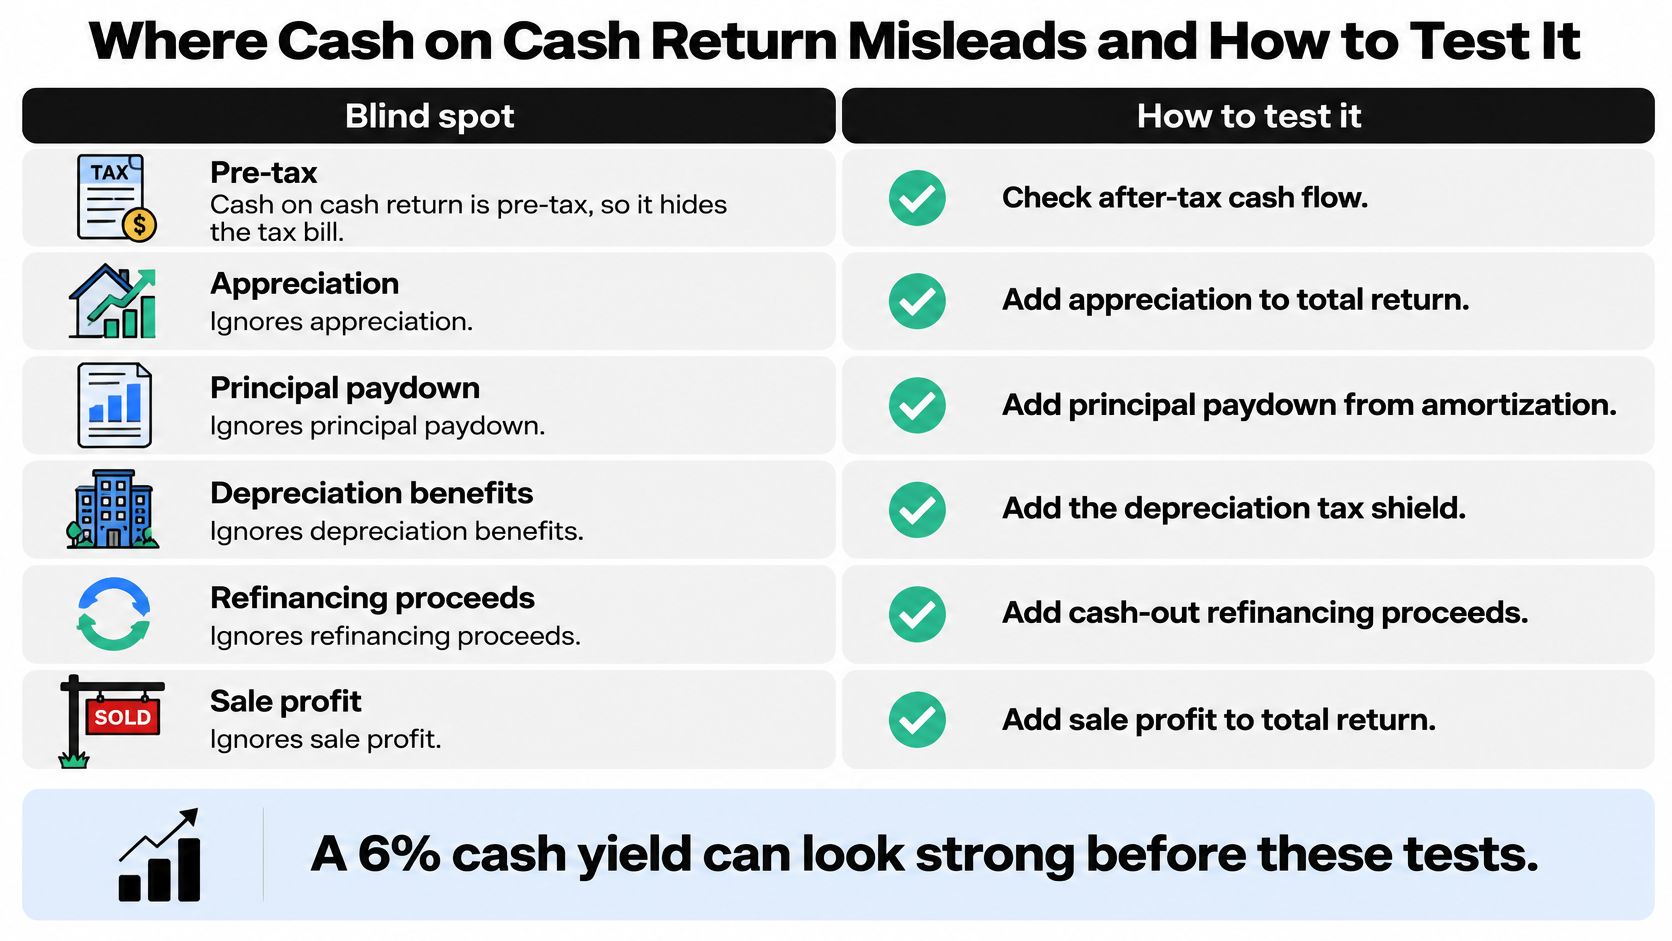
Keep those additional analyses separate rather than adding every item to annual operating cash flow. Principal repayment builds equity but doesn't create a cash distribution. Refinancing returns borrowed cash and changes your liabilities. Appreciation and sale proceeds require a holding-period model, while depreciation benefits depend on the applicable tax treatment and the investor's circumstances.
Stress-test the assumptions you can't guarantee
Build a base case and a downside case, changing identifiable inputs rather than applying an unexplained haircut to the final return.
- Interest rate and loan terms: Recalculate payments for an adverse rate scenario when the loan floats or must be refinanced. Don't change a fixed contractual payment arbitrarily.
- Vacancy and collection: Allow for longer lease-up, tenant turnover, and unpaid rent. Account for related leasing and turnover costs too.
- Rent shortfalls: Test lower achievable rents without assuming expenses fall alongside them.
- Insurance and property taxes: Replace stale seller figures with property-specific estimates, then test adverse changes.
- Repairs and reserves: Add plausible overruns and identify how much additional investor cash they require.
Report a range of cash yields, not just the base-case answer. Include break-even occupancy, the occupancy at which cash flow reaches zero, and state your minimum cash reserve. For a simple model, subtract dependable non-rent income from operating costs and debt service, then compare the remaining requirement with potential rent; adjust the calculation if expenses or reimbursements vary with occupancy.
Use a consistent pre-offer routine
Confirm the fully loaded cash contribution, then calculate the acquisition year using effective rent, property-specific expenses, and quoted debt service. Compare the result with your target and another available investment using the same cost categories and time period. Rerun the financing and occupancy assumptions before deciding whether the projected income justifies the exposure.
For a BRRRR analysis, our BRRRR Calculator shows cash left in the deal and cash flow, helping you inspect the denominator alongside the income.
This week, replace preliminary financing assumptions with a lender quote and obtain the actual rent roll before committing capital. Those documents give you a firmer basis for deciding whether the projected yield is achievable.
Our free calculators require no account and include the BRRRR Calculator, Rehab Cost Calculator, ARV Calculator, and Comp Finder. Visit PropLab to check cash left in your deal, review cash flow, and build a repair budget with contingency before making your next offer.
Tags
About the Author
P
PropLab Team
Real Estate Analysis Experts
The PropLab team consists of experienced real estate investors, data scientists, and software engineers dedicated to helping investors make smarter decisions with AI-powered analysis tools.
Free account
Underwrite your next deal in under a minute
3 free analyses, no credit card. ARV, rehab, comps and exit strategy in one report.
