General
Gross Income Multiplier Explained: Formula and Examples
October 28, 2026
14 min read
You're comparing rental buildings, and the asking prices don't make much sense beside the rent rolls. A seller mentions that a similar building sold for a certain multiple of its yearly income. That sounds useful, but before you use that multiple to shape an offer, you need to know what the seller counted as income, and what the comparison leaves out.
The gross income multiplier can help you screen a property quickly. The trick is to treat it as a market comparison, not a shortcut around checking expenses, leases, and building condition.
What a Gross Income Multiplier Tells You
Say you and another buyer are looking at similar buildings. The seller describes a nearby sale in terms of how much buyers paid for each dollar of annual income. That's the basic idea behind a gross income multiplier, usually shortened to GIM.
GIM = sale price / annual gross income
The California Board of Equalization's income-approach guide describes extracting income multipliers from closely comparable sales; its illustrative math gives a 12.0 GIM for a property selling for $2,400,000 with $200,000 in annual gross income. In everyday language, buyers paid twelve dollars of purchase price for every dollar of annual gross income.
It is similar to price per square foot, except the unit you're comparing is income rather than space. It helps you put differently priced buildings on a common basis. It doesn't tell you that their operating performance is identical.
The property discussion starts with what the building earns, not just what it looks like.

Know what gross income includes
For a potential-income GIM, gross income means anticipated income before vacancy deductions, operating expenses, debt service, or taxes. Include rent and property-related revenue such as parking, laundry, and storage. Don't subtract repair bills or mortgage payments from this denominator.
The word potential matters. An income figure assuming full occupancy isn't the same as money collected. If someone hands you a GIM without explaining the income basis, you don't yet have a usable comparison.
Read the multiple as a market observation
A GIM is extracted from sales, not chosen from a universal rulebook. The comparable buildings should resemble the property you're evaluating in use, location, physical characteristics, and income structure.
A higher multiple means buyers paid more per dollar of gross income. A lower multiple means they paid less. Neither conclusion, by itself, establishes whether they made a good investment.
The multiple isn't a payback period. Owners don't keep every dollar of gross revenue, and the ratio doesn't calculate investment returns. It's a screening ratio, not a complete valuation.
How to Calculate a Gross Income Multiplier Step by Step
A spreadsheet is enough to calculate GIM. The harder job is making sure each row describes a comparable transaction and uses the same income definition.
Use this process as a checklist rather than a reason to accept every nearby sale.
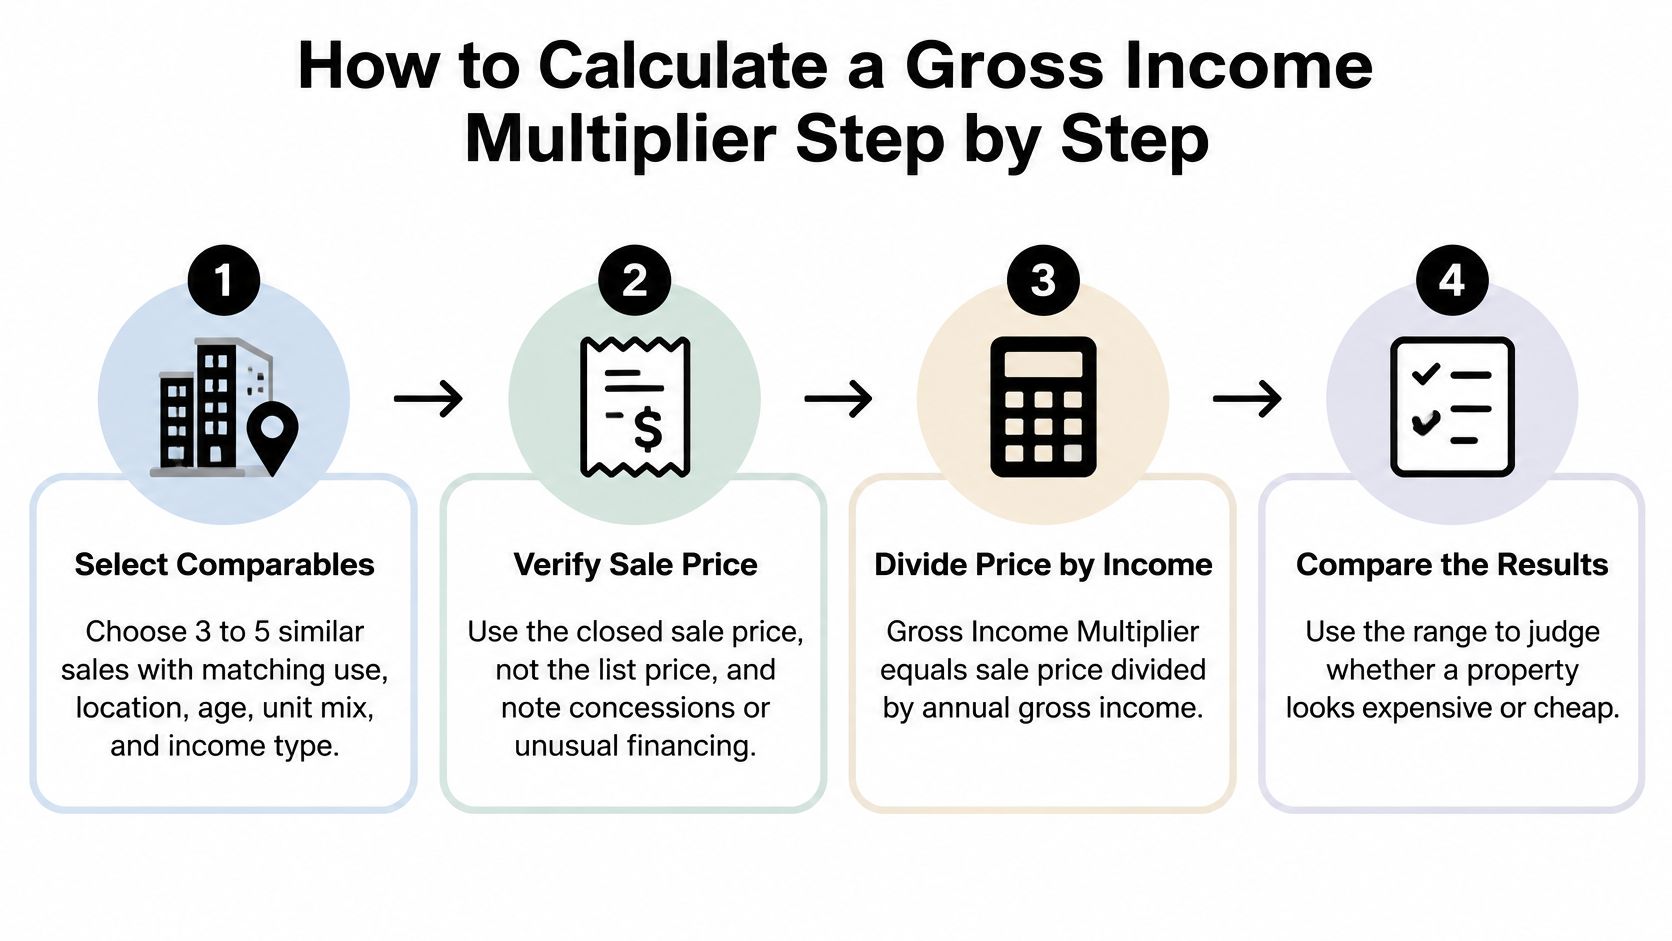
Build a consistent comparison set
Select comparable sales. Start with a small group of buildings with matching use, submarket, age, unit mix, and income sources. The common mistake is choosing properties because they're nearby while overlooking differences in tenant profile or building scale.
Verify the closed sale price. Use the completed transaction price, and record concessions or unusual financing that might affect how you interpret it. A listing price tells you what the seller wants, not what a buyer agreed to pay.
Establish the annual income basis. Choose a clearly labeled definition, such as anticipated potential gross income, and apply it consistently across the comparison set. Don't combine a seller's optimistic market-rent projection for one building with documented collections for another.
Divide price by income. Put the verified sale price in the numerator and annual gross income in the denominator. Check that you haven't accidentally used monthly income or reversed the formula, and keep rounding consistent.
Turn the calculations into a working estimate
Investigate the spread. Flag multiples that sit apart from the rest, then examine condition, lease terms, transaction circumstances, and unusual revenue. Don't remove an inconvenient sale merely because it weakens your preferred valuation.
Choose a defensible working multiple. The median can provide a useful starting point because an extreme observation won't pull it as strongly as it would an average. Still, don't let a tidy calculation give weak comparables more credibility than they deserve.
Apply the multiple to the subject. Multiply the subject property's annual gross income, measured on the matching basis, by your working GIM. Label the result indicated value, and retain the comparison range rather than presenting the midpoint as an exact answer.
Practical rule: If you can't explain why a comparable belongs in the spreadsheet, don't let its multiple help set your offer.
A sound comparison set usually produces multiples that cluster reasonably closely. A scattered set calls for investigation, not more decimal places.
The calculation also needs a separate cash-flow check. Royal LePage Brookside Realty's resource to calculate rental property cash flow can help you organize the income and outgoings that a gross-income screen leaves outside the calculation.
For a visual walkthrough of the calculation, use the accompanying video.
Worked Examples From Comparable Sales
Consider a hypothetical comparison exercise, not a report of actual transactions. Assume you've verified the sales, aligned their annual income definitions, and determined that the buildings are plausible peers.
Comparable A supplies the middle observation. Comparable B shows buyers paying less per dollar of income, while Comparable C shows them paying more.
Use the median without hiding the range
Three comparable sales and the implied value of a $250,000 subject property
| Property | Sale price | Gross income | GIM | Subject value at this GIM |
|---|---|---|---|---|
| Comparable A | $2,400,000 | $200,000 | 12.0 | $3,000,000 |
| Comparable B | $1,500,000 | $150,000 | 10.0 | $2,500,000 |
| Comparable C | $3,300,000 | $260,000 | 12.7 | $3,175,000 |
| Subject at median multiple | Not sold, value being estimated | $250,000 | 12.0 | $3,000,000 |
All amounts in this table are hypothetical teaching inputs or calculations, not market evidence. The final column uses the displayed, rounded multiple consistently, including for Comparable C.
For Comparable B, the arithmetic is $1,500,000 / $150,000 = 10.0. Comparable C produces $3,300,000 / $260,000, rounded to 12.7.
Put the multiples in order and the median is 12.0. Applying it to the hypothetical subject gives $250,000 × 12.0 = $3,000,000.
But the comparison set also supports a hypothetical screening range of $2,500,000 to $3,175,000 using its lowest and highest displayed multiples. That's a meaningful difference for an investor deciding how much additional diligence to undertake.
Don't just split the difference and call the result fair value. Ask whether the lower-multiple building needed substantial work, whether the higher-multiple building had a stronger location, or whether a transaction included circumstances that make it a poor comparison.
For an initial property search, investors building a comparison workflow can access Zillow home comparison data through RealtyAPI.io. Treat property comparison records as leads to investigate, then separately verify sale terms and income documents before calculating a GIM.
Change the income definition and the answer changes
Now consider a separate hypothetical mixed-use building selling for $2,400,000. Assume it earns $180,000 in annual rent and $20,000 from parking and storage.
Using total gross income, the calculation is:
Hypothetical GIM = $2,400,000 / $200,000 = 12.0
Using rent alone, the same hypothetical sale produces a gross rent multiplier of $2,400,000 / $180,000 = 13.3, rounded.
The building didn't change. The sale price didn't change. You changed the denominator and therefore changed the metric.
That distinction becomes dangerous when a seller quotes a total-income multiple for the subject while you compare it with rent-only multiples from other properties. The subject can appear less expensive because you counted more categories of revenue.
Before accepting ancillary income, examine its source. Confirm that parking charges are collectible under the relevant arrangements, storage income belongs to the property, and laundry revenue represents the owner's share rather than the machine operator's total receipts.
A larger income denominator needs documentary support. Otherwise, the apparent value advantage may exist only in the spreadsheet.
Gross Income Multiplier, GRM and Cap Rate Compared
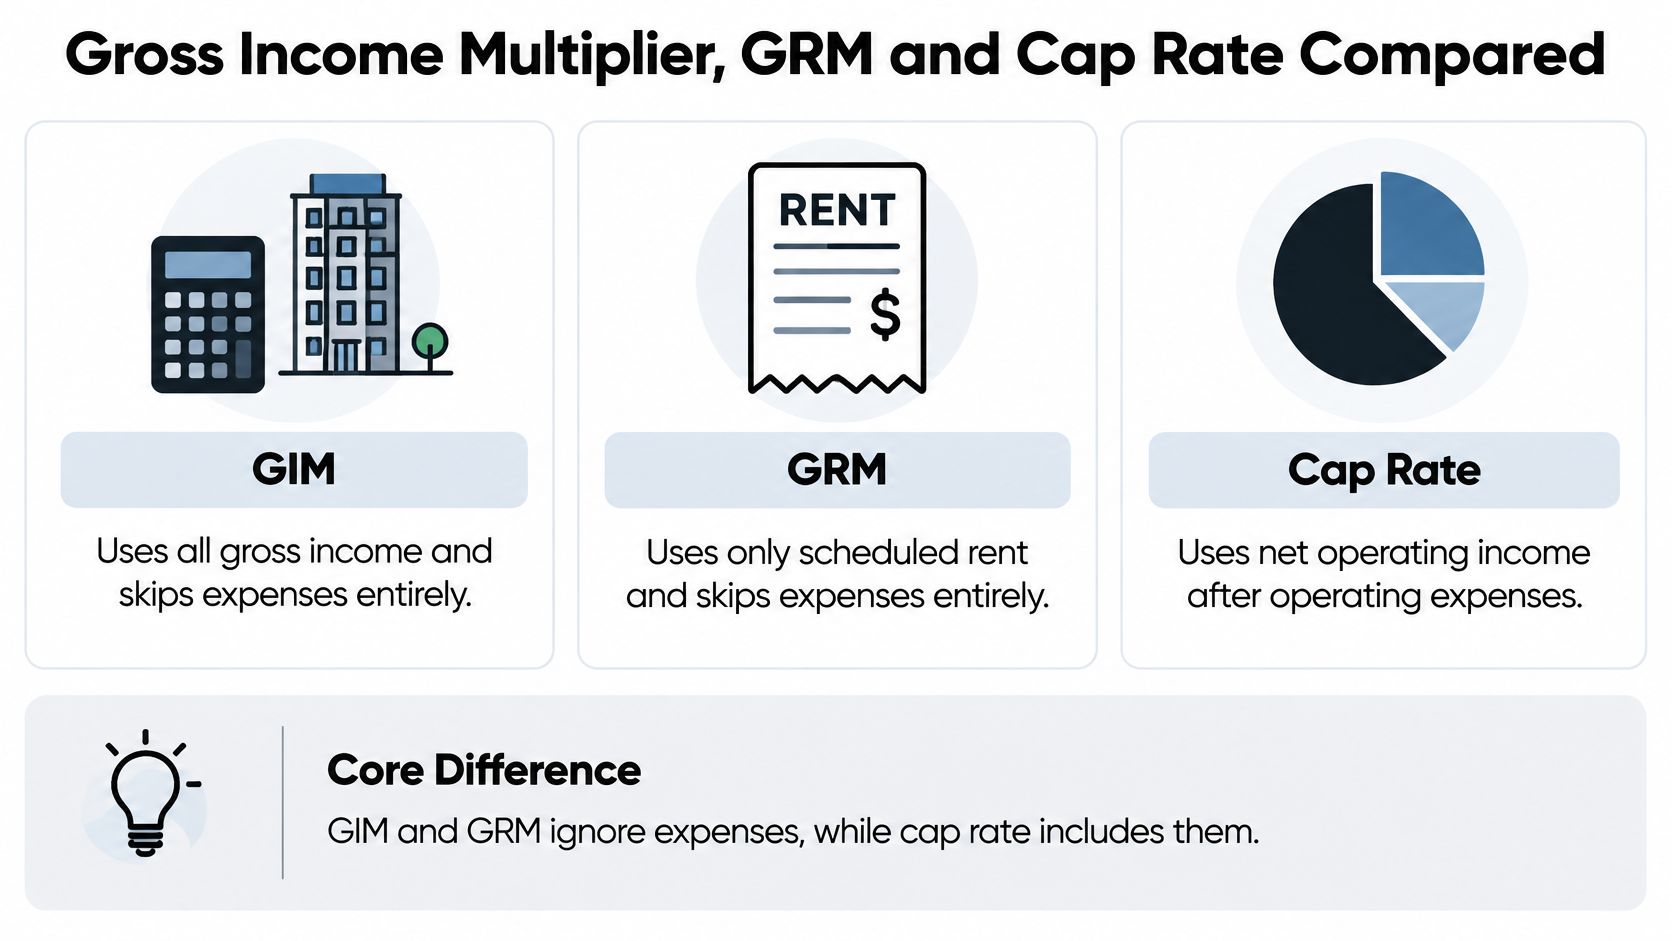
The easiest way to distinguish these metrics is to ask which income line each calculation uses. GIM starts with total gross property income, GRM focuses on rent, and cap rate uses income remaining after operating expenses.
Those differences determine what you can reasonably conclude. A low gross-income multiple can identify a property worth investigating, but it can't establish that the owner will retain much of the revenue.
The comparison below separates the income bases visually.
Match the metric to the records you have
Valuation metrics compared on the same criteria
| Metric | Formula | Income used | Counts expenses or vacancy? | Best fit |
|---|---|---|---|---|
| Gross income multiplier (GIM) | Sale price / gross income | All gross income, including non-rent income | No explicit deduction when using potential income | Mixed-income properties and fast screening |
| Gross rent multiplier (GRM) | Sale price / gross scheduled rent | Scheduled rent only | No | Small residential rentals with rent-only income |
| Effective gross income multiplier | Sale price / effective gross income | Gross income minus vacancy and credit loss | Vacancy yes, operating costs no | Deals where vacancy is a known risk |
| Cap rate | Net operating income / sale price | Income after operating expenses | Yes, when vacancy is included in NOI | Comparing property-level income returns |
Effective gross income provides a middle ground. You deduct vacancy and credit loss before calculating its multiplier, but you haven't yet deducted the costs of operating the building.
Be precise when labeling it. A multiplier calculated from effective income shouldn't sit beside potential-income multiples as though they measure the same thing.
Why cap rate adds a different check
Net operating income, or NOI, accounts for operating costs such as insurance, management, maintenance, owner-paid utilities, and property taxes. It excludes mortgage payments and the investor's personal income taxes.
That makes cap rate more informative about the property's operating return, though it still doesn't describe your financed cash-on-cash return or every future capital requirement. Use the cap rate equation for real estate to connect the property's NOI with its proposed purchase price.
A higher income multiple generally corresponds to a lower cap rate only when the properties retain similar proportions of gross income as NOI. If their expense burdens differ, that relationship can break down.
For example, consider otherwise similar buildings where one owner pays heating costs and the other passes them to tenants. Comparing gross revenue alone misses a material difference in what the owners keep.
The practical pairing is straightforward: screen with GIM or GRM, then underwrite the shortlist with NOI, cap rate, and a full pro forma. Don't substitute the easiest available calculation for the one your decision requires.
Pros, Cons and Blind Spots of the Method
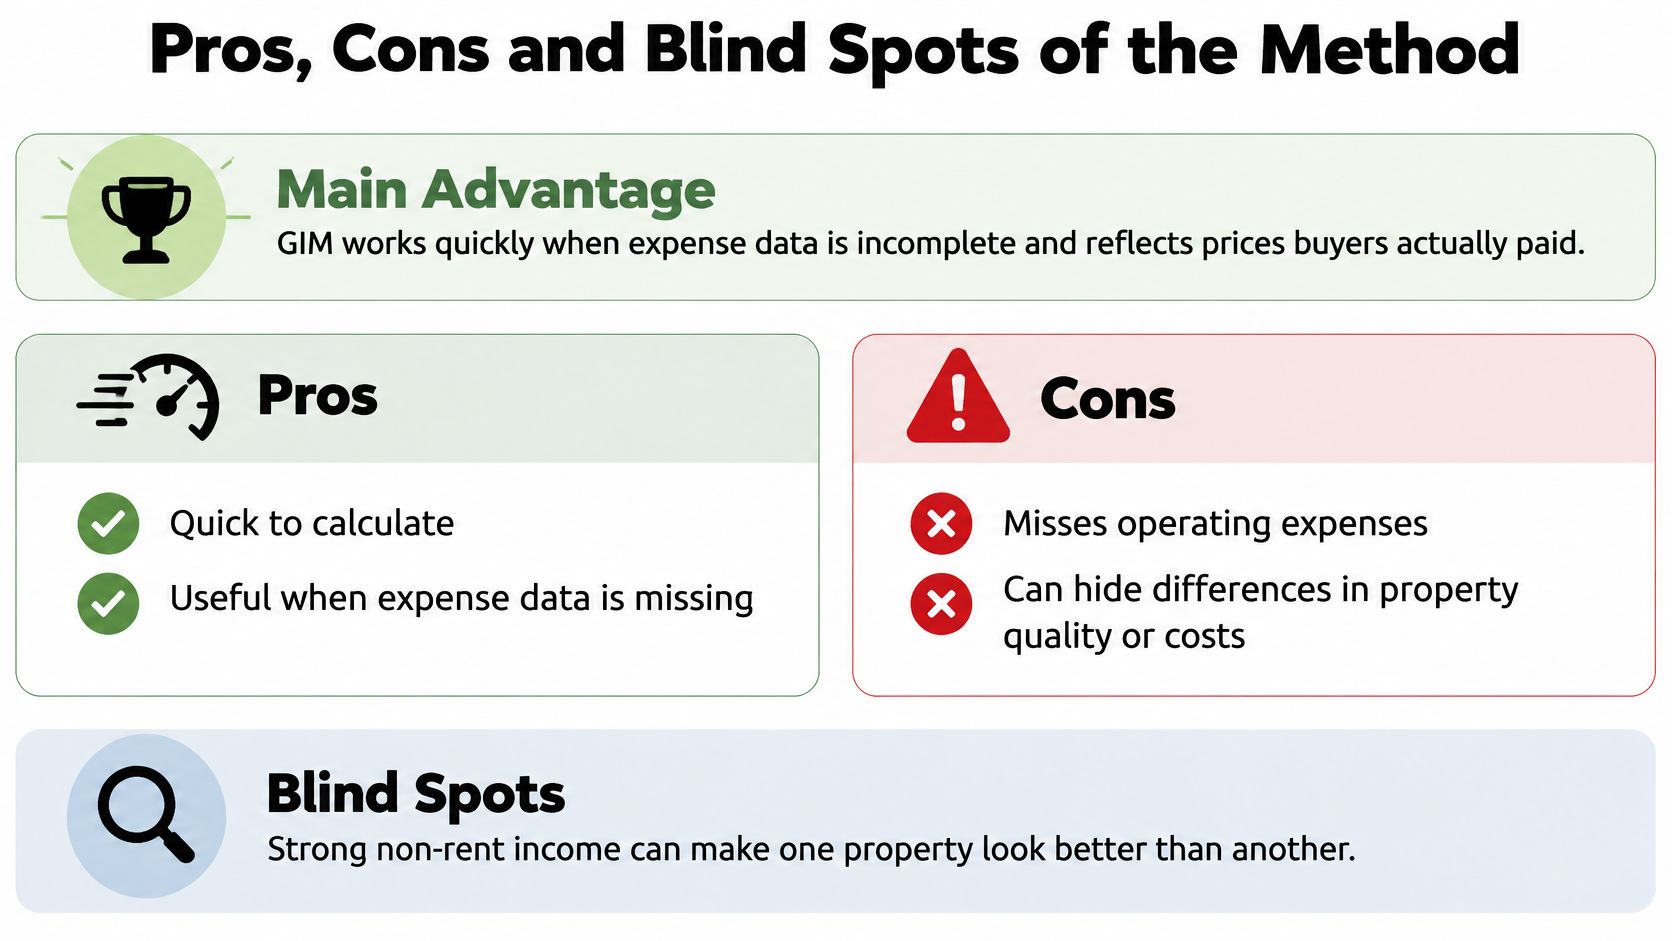
GIM's strongest advantage is speed when expense records are incomplete. You can compare a documented sale price with a clearly defined income figure without first reconstructing every operating cost.
That convenience doesn't make the method careless by default. The question is whether the properties are sufficiently alike for gross income to serve as a useful comparison.
What makes the shortcut useful
- Fast calculation. A modest spreadsheet can turn a set of verified sales into a workable market screen.
- Broader revenue coverage. Total gross income includes property-related non-rent revenue that a rent-only comparison excludes.
- Readable results. Buyers can discuss price relative to income without confusing the ratio with a detailed cash-flow forecast.
An academic review of residential investment yields reports Wendt's 1974 conclusion that investors, real-estate salespeople, and mortgage lenders readily understood gross income multipliers; Jefferies' 1991 finding that they often gave the best indication of investment value for small, single-level residential rental properties in New Zealand; and a 1999 Swedish study linking changing multipliers with a speculative bubble during the country's 1980s property boom.
The strengths and weaknesses belong together when deciding how much weight to give the result.
Where investors can misread it
- Missing costs. GIM doesn't explicitly deduct operating expenses, debt payments, taxes, or capital expenditures. Potential-income calculations also leave vacancy undeducted.
- Weak comparables. A mathematically correct multiple can still produce a poor estimate if the sales aren't relevant.
- Changing expectations. Buyers may pay higher multiples because they anticipate appreciation, not because current property operations have improved.
Don't assume a high multiple always means overpriced. Buyers may be paying for better condition, stronger leases, or a more desirable location.
Equally, a low multiple isn't automatically a bargain. It may accompany expensive repairs or unreliable collections. And an income figure doesn't become comparable merely because someone labels its resulting ratio GIM.
When to Use a Gross Income Multiplier and How to Verify It
Apply a simple fit test before relying on the result: Does the property resemble its comparables, and does its income definition match theirs? If either answer is uncertain, investigate before allowing the multiple to influence your offer.
Use the following distinctions to decide whether GIM deserves a leading role or only a supporting one.
When GIM fits an investment decision
| Situation | Use GIM? | Why |
|---|---|---|
| Small residential rentals with similar units and reliable sales | Yes, as primary screen | Sales match the income type and expense data is often incomplete |
| Mixed-income property with parking, laundry or storage revenue | Yes, using total gross income | Captures non-rent revenue that GRM leaves out |
| Stabilized property with full operating statements | Secondary check only | Cap rate and net operating income give a stronger return view |
| Fast-rising market or peak-cycle pricing | Use with caution | Multiples may reflect speculation rather than income growth |
| Unique or heterogeneous assets with few comparables | No | Weak comps make the multiple unreliable |
| Lending or formal appraisal decisions | Not on its own | A single ratio doesn't establish a lender-ready appraisal |
Verify the inputs before making an offer
Recheck the closed comparables. Favor recent transactions in the same submarket and property category, with enough similarity to support the comparison. If you need older or more distant sales, document why they remain relevant.
Match income to documents. Reconcile rent rolls with executed leases and operating statements. Separate current contractual income from advertised rents, projected increases, concessions, and revenue that may not transfer to a buyer.
Recalculate the median and range. Identify which sales produce the upper and lower indications. Explain the spread in terms of property differences rather than treating every observation as equally persuasive.
Test the operating return. Build realistic operating expenses and calculate the cap rate implied by your proposed price. Use a complete rental property financial analysis to examine financing, cash flow, and capital needs before committing.
Keep an audit trail. Save the income definition, transaction documents, comparable selection notes, calculation date, and unresolved assumptions. Your analysis should be understandable to a partner who didn't help build it.
Use tools without confusing them with an appraisal
Our Comp Finder shows recent comparable sales for any address. It requires no account, as do our free ARV Calculator, Rehab Cost Calculator, 70% Rule Calculator, Fix and Flip Calculator, BRRRR Calculator, and Wholesale Calculator.
Use automated results to organize investigation, not to bypass it. Our AI output, including ARV calculations and valuations, isn't a licensed appraisal, definitive valuation, or guaranteed forecast.
For a lending decision requiring an appraisal, obtain the lender's required formal appraisal. A multiplier can support your preliminary judgment, but it isn't a substitute for that professional assessment.
PropLab offers comparable-sales tools and free calculators to help you investigate a property's value, repair budget, and rental strategy before setting an offer. Visit PropLab to find recent comparable sales, then pair your gross income multiplier screen with an expense-based analysis of the deal.
About the Author
P
PropLab Team
Real Estate Analysis Experts
The PropLab team consists of experienced real estate investors, data scientists, and software engineers dedicated to helping investors make smarter decisions with AI-powered analysis tools.
Free tool
Get the ARV of any property in 30 seconds
Skip the spreadsheet. Enter an address and get an after-repair value backed by real comps.
