General
Gross Rent Multiplier Calculator: How to Use GRM Right
September 19, 2026
15 min read
You're probably looking at a stack of listings right now. A few seem cheap, a few seem shiny, and most sit in the uncomfortable middle where the asking price might work if the rent is real. That's where a gross rent multiplier calculator earns its keep.
On busy acquisition days, GRM is the fastest way to stop wasting time. It doesn't tell you what to buy. It tells you what deserves another ten minutes. That distinction matters more than most calculators admit.
A lot of investors use GRM casually, plug in listing rent, divide price by annual gross rent, and move on. That works only when the rent input is clean. In practice, it often isn't. Units sit partially vacant. Sellers advertise pro forma rent instead of in-place rent. Concessions hide behind headline rents. A calculator can't fix bad inputs.
Why Smart Investors Use GRM as a First Filter
The cleanest use of a gross rent multiplier calculator is triage.
Say you pull a batch of listings on a Saturday morning and want to narrow them before lunch. You don't need a full rent roll review, tax estimate, insurance quote, and financing model on every address. You need one fast question answered first: Does this asking price sit anywhere near what similar rentals trade for on a gross-rent basis?
That's what GRM does well. It compresses the first pass into a single ratio. The metric itself has been around for a long time. Historical benchmark data show average GRMs in the early 1890s at 14.1 for single-family houses, 9.5 for tenements, and 10.1 for apartment houses, with later shifts into different ranges across property types and eras, which shows how long investors have used GRM as a compact shortcut for comparing income-producing housing in major rental markets (historical GRM benchmarks from NBER).
Why the shortcut feels so intuitive
Buyers naturally think in price-to-rent terms. If a property costs many years of rent upfront, they pause. If the price lines up with a manageable multiple of rent, they keep reading. GRM is just the cleaner professional version of that instinct.
On small residential rentals, especially single-family and small multifamily, that shortcut is useful because listings move faster than underwriting. A one-line calculator lets you spot obvious overpricing before you sink time into photos, lease assumptions, and seller stories.
Practical rule: Use GRM to eliminate deals, not to justify them.
What GRM catches and what it misses
GRM catches pricing relative to gross income. It does not catch whether the income is durable, whether expenses are bloated, or whether the rent figure is inflated.
That sounds like a flaw, but it's also why the metric works early. The more variables you add at the start, the slower your screening gets. GRM stays fast because it ignores operating costs, debt service, taxes, and financing structure.
That same simplicity becomes dangerous if you confuse a screen with a valuation.
A newer generation of guides has started to say this more clearly: GRM ignores operating expenses, financing, and local market structure, which is why many investors now use it beside other quick screens rather than by itself (Wall Street Prep on GRM limitations).
The right mindset
Think of GRM like a sorting tray.
- Green light: The asking price looks plausible against rent.
- Yellow light: The ratio is close enough to warrant normalized rent and expense review.
- Red light: The deal is priced so far from local gross-rent reality that it probably doesn't deserve deeper work.
If you use it that way, a gross rent multiplier calculator saves hours. If you use it as proof that a deal is good, it will hand you false confidence.
The GRM Formula and a Clean Worked Example
A listing hits your inbox at $300,000. The broker says the property brings in $2,500 a month. Before opening an expense model, the first question is simple: what multiple of gross rent is the seller asking you to pay?
GRM = Property Price / Gross Annual Rent
That is the whole formula. If rent is quoted monthly, multiply by 12 first. A standard example uses a $300,000 property with $2,500 per month in rent, which converts to $30,000 in annual gross rent and a GRM of 10 (GRM formula example at Global Calcs).
A clean example you can copy
Use a duplex with an asking price of $300,000 and combined monthly rent of $2,500.
Annual gross rent is $30,000. Divide $300,000 by $30,000 and the GRM is 10. In plain terms, the asking price is equal to about 10 years of gross scheduled rent.
| Step | Input | Value |
|---|---|---|
| 1 | Asking price | $300,000 |
| 2 | Gross monthly rent | $2,500 |
| 3 | Annualized gross rent | $30,000 |
| 4 | GRM calculation | 10 |
That number is useful because it is fast to compare across listings. It is also easy to misuse.
GRM only works if the rent input means the same thing every time you calculate it. In practice, that is where screening gets sloppy. One broker uses current collected rent. Another uses pro forma market rent. Another blends occupied units with vacant units as if everything were already leased. The calculator will still give you a clean number, but the denominator may be carrying vacancy, concessions, or unstabilized rents that make one deal look cheaper than it is.
The formula also stays at the top line. It does not adjust for taxes, insurance, repairs, payroll, utilities, management, or debt service. That is why I treat GRM as a speed filter, not a value conclusion.
If you want a second top-line check alongside GRM, a rental yield calculator walkthrough helps compare price against income from a slightly different angle. It does not solve the same problem, but it can expose listings that only look attractive under one shortcut.
Should you annualize with a full year of rent
For a rough first pass, using monthly rent times 12 is fine. That is usually enough to sort obvious rejects from deals worth another few minutes.
Use more caution when the property is half leased, carrying free-rent concessions, or being marketed on “stabilized” income that has not shown up in the bank statements yet. In those cases, the clean math is still clean, but the rent input is not. Consistency matters more than false precision. Screen every deal on the same rent basis, or your GRM stack ranking will drift.
Normalizing Rent Before You Press Calculate
Most gross rent multiplier calculator pages stop at the formula. That's where the work begins.
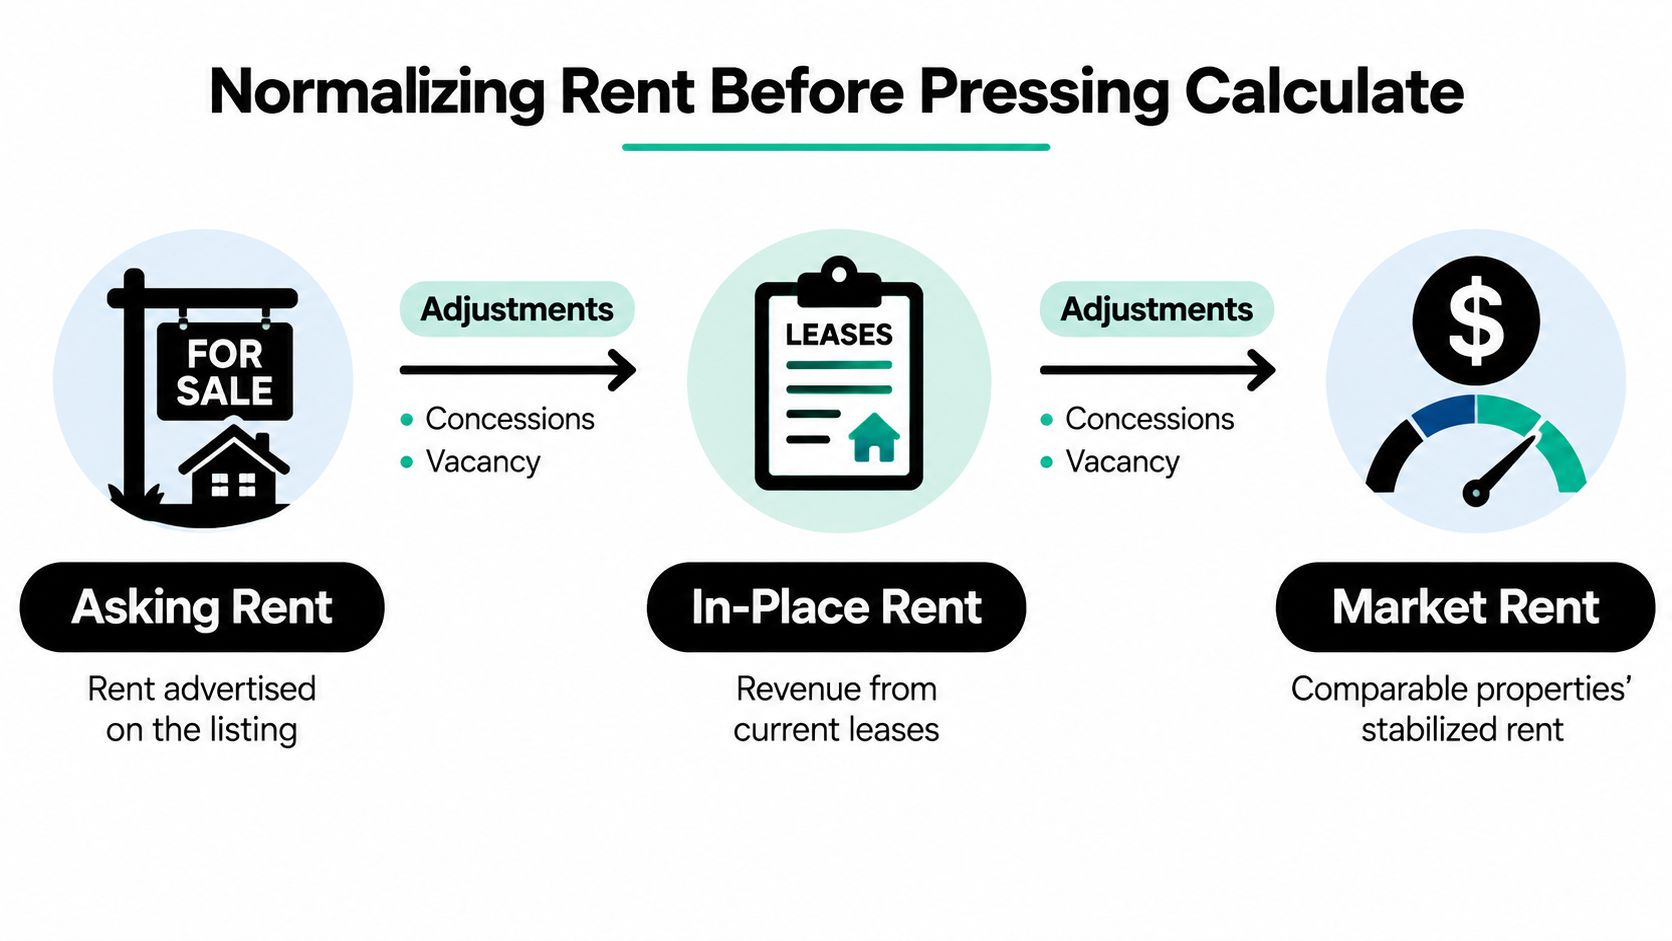
The rent line you enter should be labeled. At minimum, every rental deal has three versions of rent in circulation: asking rent, in-place rent, and market rent. If you don't distinguish them, your GRM can look precise while being built on a weak denominator.
The three rent numbers that matter
- Asking rent: The rent shown on the listing. This is the least reliable input when brokers market upside aggressively.
- In-place rent: What current tenants are paying today.
- Market rent: What comparable units should achieve once the property is stabilized.
Most calculators define GRM as price divided by annual gross rent, but they don't answer the harder underwriting question: what rent should count when the unit is partially vacant, concession-heavy, or below market? That gap is common enough that it deserves its own screening workflow (discussion of the rent-normalization gap at GRM Calculator).
A better workflow than typing the listing rent
I use this order:
- Start with in-place rent from the lease file or seller rent roll.
- Back out any concessions that reduce effective collections.
- Decide whether you're screening on current collections or a stabilized assumption.
- Cross-check against market comps so you know whether the current leases are stale, inflated, or unusually discounted.
For comp work, a practical reference is this guide on how to find rental comps. The point isn't to overbuild the screen. It's to keep the rent input defensible.
If the rent base is unstable, the GRM output is cosmetic.
What works in practice
A few habits keep the screen honest:
- Label the input clearly: Write “asking,” “in-place,” or “stabilized” next to the rent number.
- Treat concessions as real: Free rent and move-in specials reduce effective gross income, even when the headline rent looks fine.
- Be wary of partial vacancy: A vacant unit doesn't support a clean gross-rent screen unless you've made a reasoned lease-up assumption.
- Check below-market leases separately: They can make a deal look worse on current GRM and better on stabilized GRM. Both views matter.
What doesn't work is mixing these categories inside one unmarked number. That's how investors think they're comparing listings consistently when they're really comparing three different stories.
GRM vs Cap Rate vs NOI Side by Side
GRM answers one narrow question. Cap rate and NOI answer different ones.
If you line them up on the same property, the contrast gets obvious fast. GRM tells you how expensive the deal is relative to gross rent. NOI tells you what's left after operating expenses. Cap rate turns that NOI into an unlevered return metric you can compare across survivors.
Same asset, different lens
Start with a property listed at $300,000 producing $30,000 in gross annual rent. From the earlier example, the GRM is 10.
Now assume operating expenses are heavier than expected. GRM doesn't move because gross rent didn't move. But NOI shrinks, and cap rate shrinks with it. That's the core trade-off. Gross pricing can look acceptable while net economics are drifting.
| Metric | Formula | Deal A Result | Deal B at 25% Down | Deal B at 75% Down |
|---|---|---|---|---|
| GRM | Price / Gross Annual Rent | Uses gross rent only | Same GRM if price and gross rent are unchanged | Same GRM if price and gross rent are unchanged |
| NOI | Gross income minus operating expenses | Shows the effect of taxes, insurance, repairs, and management | Same property NOI before financing | Same property NOI before financing |
| Cap Rate | NOI / Price | Changes when expenses change | Unlevered metric, independent of down payment choice | Unlevered metric, independent of down payment choice |
Why financing changes the lived result
Two buyers can purchase the same property at the same price, collect the same rent, and share the same GRM. Their actual experience still won't match if they finance the deal differently.
A higher down payment changes debt service and cash-on-cash dynamics. GRM won't show that. Cap rate also won't show that, because cap rate is unlevered. You need NOI first, then the financing model layered on top.
That's why I sequence screening this way:
- First pass: GRM to kill overpriced listings quickly.
- Second pass: Cap rate to compare the properties that survived.
- Closing decision: NOI plus financing, reserves, and exit assumptions.
If you want the cap rate side built out cleanly, this walkthrough on how to calculate cap rate is a useful companion to a GRM screen.
A property can survive a GRM screen and still fail as an investment once expenses and financing hit it.
The practical distinction
Use each metric for its own job.
GRM is a screening filter. NOI is the income bridge that reveals what the property produces before debt. Cap rate is the comparison tool that lets you rank similar deals once the easy rejects are gone.
Investors get into trouble when they ask one metric to do all three jobs.
When GRM Quietly Misleads You
A listing hits your inbox at 9:15 p.m. The price looks fair. The stated rent makes the GRM look clean. Ten minutes later, you realize the seller used pro forma rents, one month free is still running on half the units, and the current vacancy is being waved away as "temporary." The ratio was tidy. The income was not.
That is how GRM causes trouble. It does not break in obvious ways. It gives a quick answer on deals where the rent number itself still needs work.
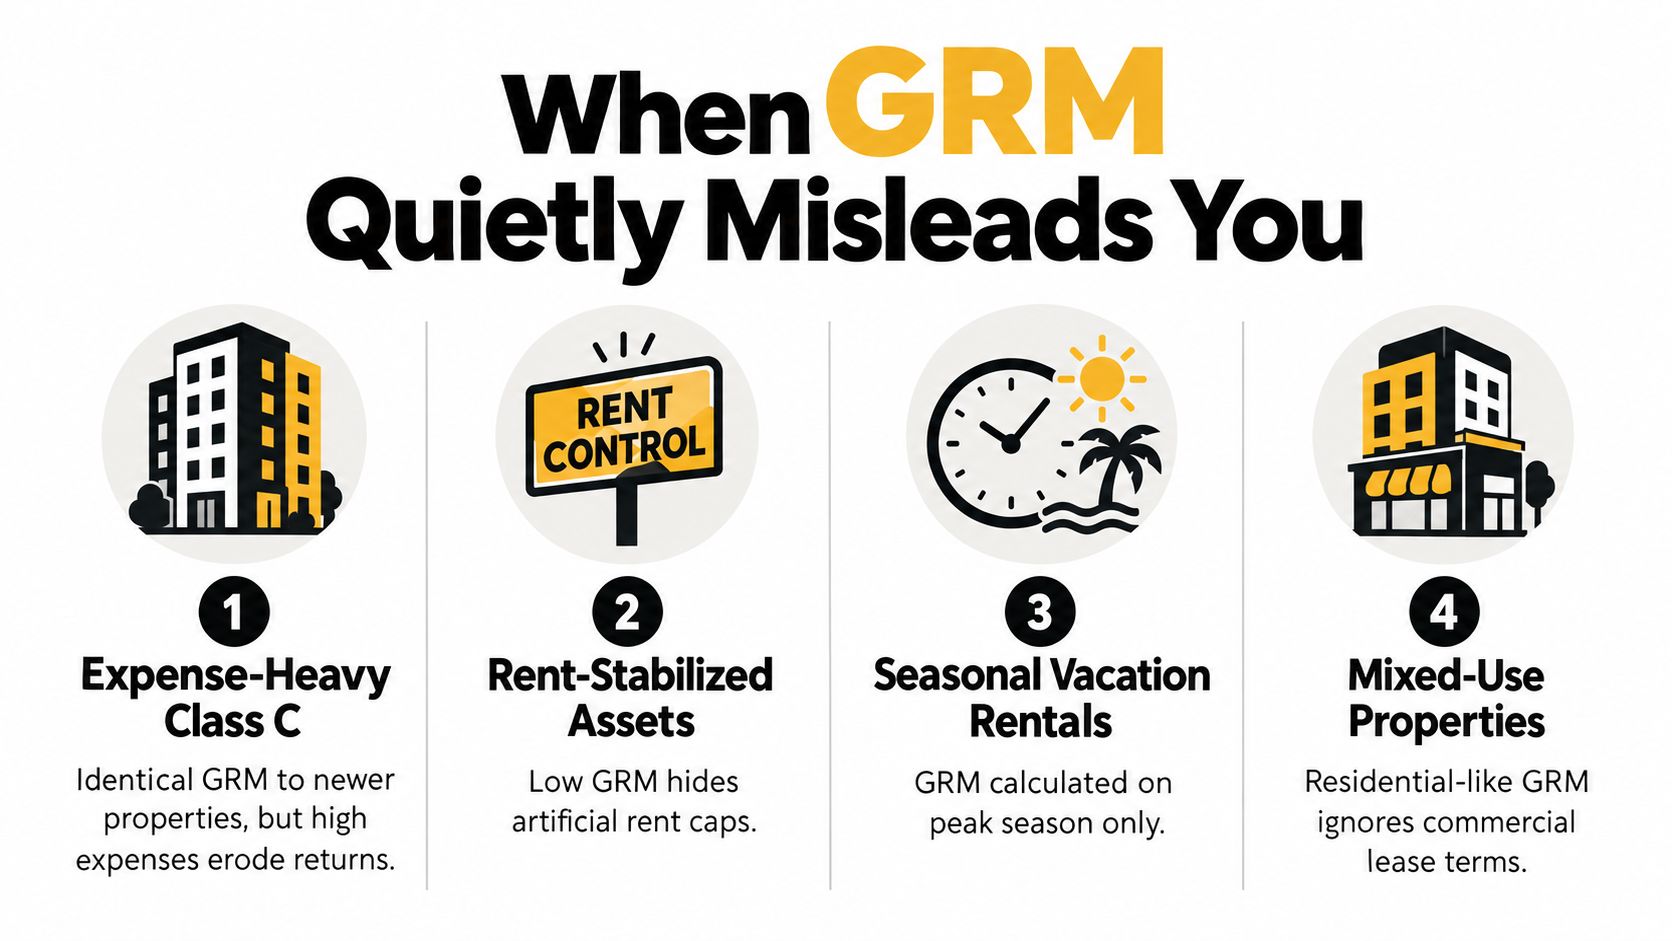
Four common failure modes
- Expense-heavy assets: Two properties can post similar GRMs and produce very different actual income after repairs, utilities, insurance, taxes, and turnover. Older housing stock causes this problem constantly.
- Lease structures that distort comparability: A gross rent number means less when one property bills back utilities, charges pet and parking fees, or shifts costs to tenants differently than the other comp set.
- Unstable occupancy or promotional rents: In-place rent during lease-up, vacant occupancy, delinquency, or active concessions can make a weak deal look acceptable, or make a decent deal look overpriced, depending on which number gets used.
- Value-add and distressed deals: If the business plan depends on rehab, repositioning, or replacing below-market leases, current gross rent is just a waypoint. GRM on day-one income does not capture the actual thesis.
The common thread is rent normalization. A lot of calculators skip it. They take the listing rent, annualize it, and output a ratio that looks precise. If the property is not stabilized, that precision is fake.
Market context still matters, but local context matters more
GRM ranges vary a lot by city, asset type, and point in the cycle. Expensive markets often carry much higher GRMs than cash-flow markets, so a ratio that looks terrible in one metro can be standard in another.
Even inside the same market, the wrong rent basis can throw off the comparison. In-place rent, loss-to-lease, concessions, bad debt, and near-term vacancy all change the denominator. If those items are not normalized, you are not comparing one GRM to another. You are comparing one assumption set to another.
Cases where I stop trusting GRM alone
GRM still earns its spot in a first-pass screen. I stop there and switch tools when the deal depends on any of the following:
- Stabilized rent instead of current collected rent
- Concessions, credits, or promotional lease terms
- Vacancy that is above normal for the submarket
- Other income that may not recur at the same level
- Major rehab before ordinary operations resume
- Property types with uneven or unusually high operating costs
At that point, another round of GRM math does not improve the decision. It just hides the uncertainty inside one clean-looking number.
GRM works best on simple, stabilized rentals with believable rent. Once the income stream needs adjustment, use GRM as a rough filter and move the deal into actual underwriting.
A Screening Calculator You Can Reuse Tonight
You don't need fancy software to build a usable gross rent multiplier calculator. A spreadsheet works fine if the columns are disciplined.
The structure I like is simple enough to maintain and clear enough to audit later. The key is separating raw rent from adjusted rent so you can see what changed and why.
The core sheet
Build these columns:
| Address | Asking Price | Gross Monthly Rent | Adjusted Rent | Annualized Adjusted Rent | GRM | Pass/Fail |
|---|---|---|---|---|---|---|
| Example property | $300,000 | $2,500 | $2,500 | $30,000 | 10 | Depends on your target |
That's enough for a nightly acquisition screen.
- Address: Keep it exact so you can match back to comps and seller files.
- Asking Price: Use the current list price or your expected contract price.
- Gross Monthly Rent: This is the raw number from the listing or rent roll.
- Adjusted Rent: Replace optimism with a defensible operating assumption.
- Annualized Adjusted Rent: Multiply the adjusted monthly figure by 12.
- GRM: Asking price divided by annualized adjusted rent.
- Pass/Fail: Set your own market-based threshold.
Add a second tab for rent normalization
Most spreadsheets become useful instead of decorative.
Include fields for:
- Starting gross rent
- Concession adjustment
- Vacancy adjustment
- Other recurring income if applicable
- Stabilized market rent from comps
- Final adjusted rent used in GRM
If you want help thinking through effective rent inputs before they flow into GRM, this overview of Divvy rent calculator features is useful because it frames concessions and effective rent in a practical way.
Three rules that keep the sheet honest
- Update your comp view regularly: Old rent assumptions age badly, especially in fast-moving submarkets.
- Don't trust in-place rent blindly on a “stabilized” listing: Verify whether the current leases reflect the story the seller is selling.
- Treat Pass/Fail as triage only: A pass means “review further,” not “submit an offer.”
If you want a tool instead of a spreadsheet, PropLab includes GRM inside its rental analysis and can surface the ratio alongside comp-based deal work. That's useful when you want the quick screen and the deeper underwriting trail in one place without rebuilding the same inputs.
A solid GRM screen isn't about sophistication. It's about using a narrow metric correctly, keeping the rent denominator honest, and moving losing deals out of the pipeline before they consume attention.
PropLab helps investors move from quick rental screens to offer-ready analysis without stitching together separate tools. If you're sorting through deals where rent assumptions, comps, rehab, and pricing all need to line up fast, visit PropLab and see how it fits into your underwriting workflow.
Tags
About the Author
P
PropLab Team
Real Estate Analysis Experts
The PropLab team consists of experienced real estate investors, data scientists, and software engineers dedicated to helping investors make smarter decisions with AI-powered analysis tools.
Free account
Underwrite your next deal in under a minute
3 free analyses, no credit card. ARV, rehab, comps and exit strategy in one report.
