General
Market Opportunity Assessment: A Step-by-Step Guide
October 14, 2026
12 min read
A professional investment platform can produce an offer-ready analysis in about 60 seconds, turning raw property data into a practical acquisition decision. The near-term opportunity isn't the entire real estate market, but the smaller portion with sufficient transaction liquidity, reliable comparable sales, and buyers willing to act.
A market opportunity assessment answers a more useful question than “How large is the market?” It asks: Which properties can I evaluate, finance, acquire, improve, and exit profitably under current conditions? That distinction separates an impressive theoretical market from a serviceable pipeline of real deals.
Understanding Real Estate Market Opportunity
The professionally managed global real estate investment market was valued at approximately $12.5 trillion in 2024, although the market contracted 4.1% during the year and declined for the third consecutive year after more than a decade of expansion. Transaction volume still rebounded 18% as interest rates stabilized and the gap between buyers and sellers narrowed, according to UBS's global real estate outlook.
That headline figure demonstrates scale, not immediate opportunity. A property platform, acquisition team, or underwriting product can't serve every asset in a $12.5 trillion market. It serves a narrower group defined by property type, location, ownership structure, transaction activity, data access, financing conditions, and investor behavior.
The same UBS analysis shows why liquidity matters. The global turnover ratio, calculated as annual transaction volume divided by market size, rose from 4.0% in 2023 to 6.2% in 2024. Even after the rebound, most professionally managed real estate did not change hands during the year. A large asset base therefore shouldn't be confused with a large pool of immediately actionable deals.
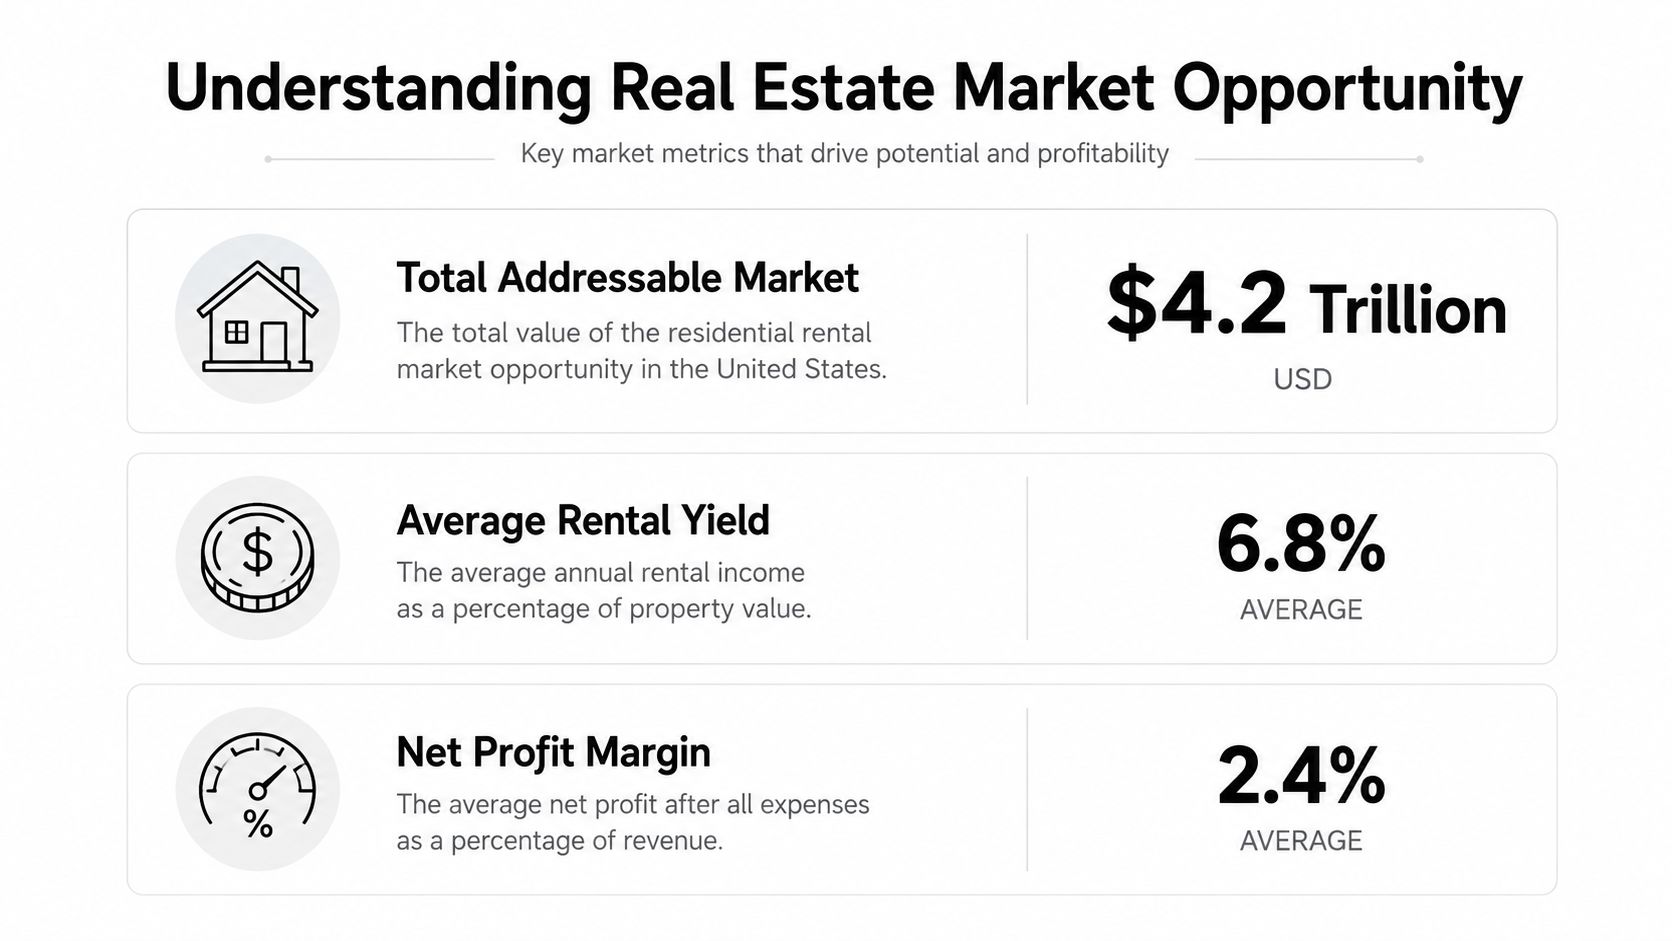
Top-down size versus bottom-up liquidity
A practical assessment uses two lenses:
- Top-down scale: Total property value, investable stock, addressable geography, and broad customer categories.
- Bottom-up liquidity: Completed transactions, active investors, local turnover, available records, financing access, and expected usage frequency.
For example, a tool aimed at acquisition teams shouldn't size its opportunity from total housing value alone. It should examine how many properties transact in its target counties, how often investors buy, how quickly users need an answer, and whether the data supports a defensible offer.
This approach also prevents a common mistake. A large market can remain commercially weak if transactions are infrequent, records are incomplete, or the intended customer doesn't change workflows. Conversely, a smaller market can support a profitable product when investors transact repeatedly and each decision carries meaningful financial consequences.
For a useful explanation of property-level research, cash flow, comparable sales, and market conditions, Homebase's investment research guide provides a practical reference point. Use resources like that to frame the market, then narrow the analysis to the specific geography and asset type your team can serve.
Practical rule: Treat total market value as the ceiling. Treat transaction liquidity, data quality, and customer adoption as the filter.
Defining Scope and Gathering Comparable Sales
A reliable market opportunity assessment starts with a narrow question. “Is this market attractive?” is too broad to guide an acquisition decision. “Can a fix-and-flip investor underwrite three-bedroom homes in this county using recent, condition-matched sales?” is testable.
Define the target before collecting data. Specify the property type, geography, customer segment, investment strategy, and decision the analysis must support. A wholesaler may need a rapid assignment screen, while a buy-and-hold investor needs rent, expenses, financing, and long-term occupancy assumptions. The same county can present different opportunities for each user.

A disciplined comping sequence
Comparable selection is where many valuations fail. More sales don't automatically produce a better estimate. Research on the sales-comparison approach found that carefully selected comparables were more accurate than the widest possible set, with cases below a 5 dissimilarity measure achieving greater accuracy in 50.5% of observations. The findings are documented in this research on comparable selection and valuation accuracy.
Use a repeatable sequence:
- Set the search boundary. Establish a consistent radius and time window before looking at individual results. Changing the boundary to rescue a weak valuation introduces bias.
- Filter for property identity. Match property type, location, size, bedrooms, bathrooms, lot characteristics, age, condition, and transaction status.
- Rank by similarity and recency. A nearby sale with a similar layout and condition may deserve more weight than a newer sale from a different micro-market.
- Separate condition classes. Don't mix renovated, average, and distressed properties without explicit adjustments. Their prices reflect different scopes of work and buyer expectations.
- Document adjustments. Explain how size, condition, location, amenities, timing, and unusual features affect the estimate.
- Report dispersion. A valuation should show how closely the selected sales agree, not just one polished number.
The purpose of this process isn't to manufacture precision. It's to identify whether the evidence is strong enough to support an offer. If the best sales disagree materially, the correct conclusion may be that the property needs a wider risk allowance or a manual review.
Demand and supply need the same discipline
Market demand isn't just the number of people searching for homes. For an investor, demand includes the depth of the buyer pool, local resale velocity, rental appetite, financing availability, and the supply of competing properties. Supply includes listed inventory as well as distressed, vacant, inherited, tax-delinquent, or privately marketed properties that may enter the market later.
Use a comping workflow that preserves the underlying evidence. The PropLab guide to comparable sales analysis is useful for organizing selection logic, adjustments, and valuation review without treating a comp list as self-validating.
Calculating Financial Thresholds and ARV
Comparable sales become useful only after they translate into a decision threshold. After Repair Value, or ARV, estimates what a property could sell for after the planned work is complete. Maximum Offer Price, or MAO, converts that estimate into the highest purchase price the deal can support after repairs, transaction costs, financing, holding costs, selling costs, and the required profit.
A simple operating structure is:
MAO = ARV − repairs − financing and holding costs − transaction costs − selling costs − required profit
The exact deductions depend on the strategy and financing structure. The important point is that MAO is not a percentage pulled from habit. It is the output of assumptions that should be visible and easy to challenge.
Build scenarios instead of one optimistic number
Start with three ARV cases:
- Low case: More conservative resale price, longer marketing period, and weaker comp support.
- Base case: The most defensible outcome supported by condition-matched, recent sales.
- High case: Strong execution, favorable buyer response, and the upper end of credible comparable evidence.
Then run the same scenarios through repairs, timing, and exit costs. A deal that works only under the high case isn't equivalent to one that remains viable under the base case with room for normal surprises.
Current valuation conditions make this more important. Some real estate segments have repriced 20–25% over three years, while performance is increasingly shaped by sector, market, and asset-level factors rather than broad macro conditions, according to Morgan Stanley's real estate analysis.
Make uncertainty visible
Distance weighting can help, but it doesn't solve every problem. A nearby sale may still be a poor comp if its renovation quality, zoning, access, layout, or buyer profile differs from the subject property. Recency weighting also needs judgment when market conditions change between the sale date and the valuation date.
A credible report should show:
- The selected comps and why they qualify.
- The adjustments applied to each sale.
- The low, base, and high ARV.
- The effect of repair-cost changes on MAO.
- The effect of longer holding periods and lower exit prices.
- The assumptions that would invalidate the valuation.
Investors planning a substantial renovation can also consult NorCal Construction's remodeling guide for context on how renovation choices may affect resale considerations. That kind of external reference doesn't replace local comp analysis, but it can help challenge unrealistic improvement assumptions.
For repeatable deal math, the PropLab fix-and-flip calculator can help organize ARV, repairs, costs, and offer thresholds. Whether you use a calculator, spreadsheet, or underwriting platform, don't accept a single-point ARV when the evidence supports only a range.
Identifying Risks and Scoring Opportunities
A market can look attractive and still produce poor deals. The difference usually appears in the assumptions that weren't tested: repair scope, title condition, buyer demand, insurance availability, local competition, or the time required to convert an off-market lead into a financeable asset.
Research covering 203 industrial product launches found that well-defined predevelopment activities produced a 75% success rate, compared with slightly above 31% when those activities were weak or absent, as reported in this study of market analysis and product launch outcomes. Real estate investors face a similar lesson. Early diligence doesn't guarantee a profitable deal, but weak diligence makes avoidable errors more likely.
Score the opportunity, not just the property
A useful scorecard separates evidence from enthusiasm. Score each target county, neighborhood, or investor segment independently across criteria such as:
- Transaction activity: Are enough relevant properties changing hands to support the strategy?
- Distress prevalence: Are there credible sources of discounted inventory, or only broad claims about opportunity?
- Data availability: Can you verify ownership, liens, permits, sales, taxes, and property condition?
- Investor density: Are there active buyers who repeatedly need underwriting and sourcing support?
- Expected gross margin: Does the deal structure leave room for repairs, delays, and negotiation?
- Willingness to pay: Will the customer pay for faster analysis or change an existing workflow?
Set explicit go and no-go thresholds before reviewing individual leads. A county with strong transaction activity but weak records may require manual research. A county with excellent records but little investor activity may not justify expansion. The scorecard should expose that trade-off rather than bury it in one composite number.
A cheap property is not automatically an opportunity. It may be cheap because the title, structure, access, environmental history, or resale demand creates work that the headline price doesn't show.
Treat off-market supply as a risk-adjusted pool
More than 70% of flips began off-market, and small local operators represented 93.4% of investment activity in the analyzed markets, according to the industry report on local investors and off-market activity. The report also estimated 15 million vacant homes nationwide. Those figures point to a large sourcing pool, but they don't prove that vacancy or off-market status creates profit.
Off-market leads require a bridge from public records to investability. Check ownership duration, liens, code violations, permit history, vacancy signals, neighborhood liquidity, buyer demand, and the likely cost and time required to make the property saleable. Compare the resulting leads with completed sales in the same local market so you can distinguish overlooked assets from difficult assets.
Physical due diligence belongs in the same decision gate. For commercial or multifamily properties, a resource such as this guide for South Florida property managers can help frame roof inspection questions, but local professionals still need to verify the actual building.
Don't expand coverage because a theoretical market looks large. Require support from public records, customer interviews, observed workflow behavior, and paid or pilot usage before committing more resources.
Automating the Assessment Process with PropLab
Manual analysis remains valuable for unusual properties and final diligence, but it doesn't scale well for repeated screening. Analysts have to gather records, locate comparable sales, inspect condition clues, adjust for distance and recency, calculate repairs, test exit assumptions, and prepare a report. Repeating those steps under time pressure creates opportunities for missed data and inconsistent judgment.
PropLab is an AI-powered underwriting platform that combines public records, tax data, and market signals without requiring MLS access. It identifies relevant comparable properties, applies distance and recency weighting, presents adjustment details and confidence scoring, estimates rehab costs, and produces an offer-ready report containing an MAO and red flags.
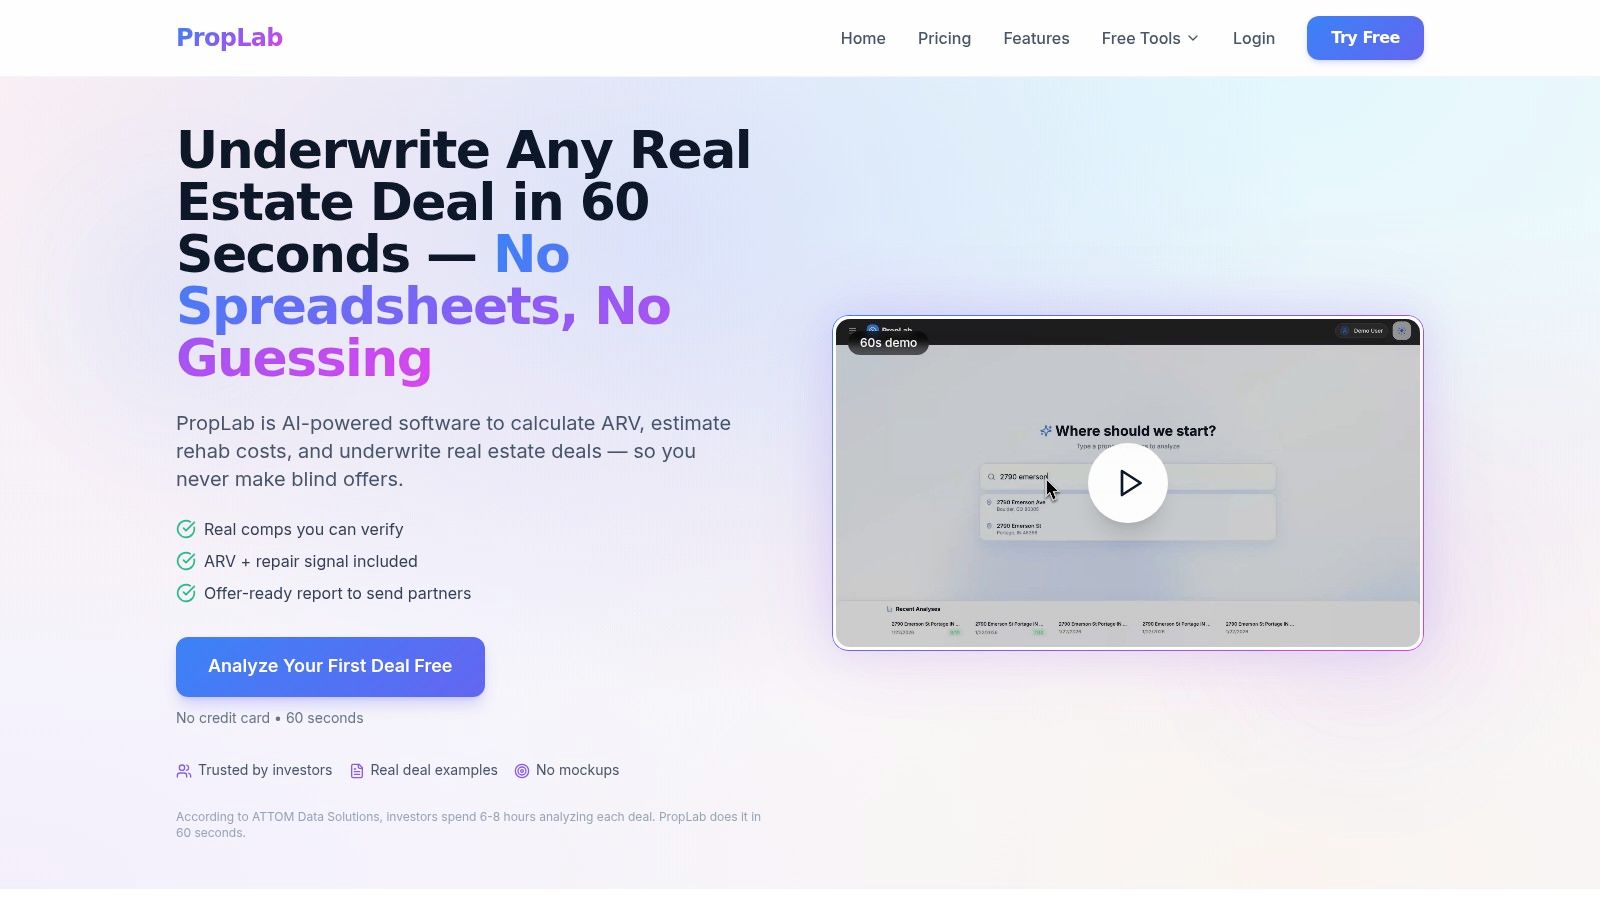
The practical value is workflow compression. Instead of beginning every lead with a blank spreadsheet, an investor can use an automated first pass to decide which properties deserve deeper inspection. The platform also includes a Daily Deals scanner across 90+ major U.S. counties, giving acquisition teams a way to build a pipeline around defined criteria rather than browsing listings without a decision framework.
Use automation as a validation layer
Automation shouldn't replace judgment. It should make the assumptions easier to inspect and the first decision faster. Start by confirming the property identity, then review the selected comps, condition indicators, repair estimate, ARV range, and offer threshold. Reject the output for manual review when the property has an unusual layout, uncertain zoning, limited comparable evidence, major structural concerns, or a rapidly changing micro-market.
Investors using PropLab report ARV estimates within 3–5% of actual sales, and the platform delivers offer-ready reports with comp selection and red flags in about 60 seconds. Those figures are product-reported benchmarks, so investors should still compare results against their own closed deals and local valuation standards.
The output can be exported as a professional PDF or shared through a link with partners and lenders. That matters because an opportunity assessment only creates value when the acquisition team can review the evidence, challenge assumptions, and act before the lead goes stale.
For teams looking beyond isolated calculations, real estate workflow automation offers useful context on connecting research, underwriting, reporting, and collaboration into a repeatable process.
A sound process remains gated even when software is fast. Define the segment, screen the market, verify the comps, calculate the financial threshold, score the risks, and validate the result against observed outcomes. Automation makes that sequence practical across more leads, but it doesn't turn weak evidence into a strong investment.
PropLab helps investors turn market opportunity assessment into a repeatable underwriting workflow, with comparable analysis, ARV, rehab estimates, risk indicators, and offer-ready reporting in about 60 seconds. Test the process on your next acquisition and visit PropLab to evaluate whether its automated validation fits your sourcing and underwriting routine.
About the Author
P
PropLab Team
Real Estate Analysis Experts
The PropLab team consists of experienced real estate investors, data scientists, and software engineers dedicated to helping investors make smarter decisions with AI-powered analysis tools.
Free account
Underwrite your next deal in under a minute
3 free analyses, no credit card. ARV, rehab, comps and exit strategy in one report.
