General
8 Valuation Model Example Templates for Real Estate
October 8, 2026
18 min read

A property can look like a bargain until the underwriting catches up. The comparable-sales analysis suggests a strong after-repair value, but the rehab estimate expands, financing costs accumulate, projected rent falls short of debt service, or the exit takes longer than planned. The investor doesn't need another formula in isolation. They need a valuation model example that shows the inputs, the calculation, the assumptions, the uncertainty, and the decision the result supports.
The eight templates below connect each valuation method to a repeatable workflow. You'll see how to select the right model, test its weak points, and translate the output into an offer, financing limit, or hold decision. Spreadsheet-style callouts, practical scenarios, and short walkthroughs make the models reusable, while PropLab can reduce manual work by gathering property data, selecting relevant comparables, estimating repairs, and producing shareable reports.
1. Comparable Sales Approach
The comparable-sales approach starts with market evidence, not a target price. An analyst identifies recently sold properties that resemble the subject, verifies the transactions, adjusts for meaningful differences, and reconciles the adjusted indications into a value estimate. The Appraisal Foundation guidance on comparable properties emphasizes side-by-side analysis of physical and transaction characteristics rather than unsupported price-per-square-foot assumptions.
Consider a 1,200-square-foot, three-bedroom, two-bath fixer-upper. Three nearby sales close at $300,000, $325,000, and $350,000, but the raw average is only a starting point. If one comparable needs a $15,000 upward adjustment because it has inferior condition, its indication becomes $315,000. If another has superior renovations and requires a $10,000 downward adjustment, its indication becomes $340,000. The final value should give more weight to the most similar evidence, not merely average the sale prices.
Practical rule: A newer comparable isn't automatically better. Similarity, verification, market conditions, and physical characteristics determine usefulness.
Fannie Mae guidance also recognizes that the most appropriate comparable may not be the most recent and that truly comparable sales may be unavailable. That matters in rural markets, thinly traded neighborhoods, unique housing types, and rapidly changing conditions. Rank each comparable by distance, recency, condition, legal characteristics, and market competitiveness, then show how the estimate changes when weaker evidence is removed.
For a flip, use the reconciled value as an ARV input only after defining the renovation scope. For a wholesale offer, use the evidence to establish a defensible ceiling. For a lender, document each adjustment so the ARV can be reviewed rather than accepted as a black-box conclusion. PropLab's comparable sales analysis workflow can support this process with distance and recency weighting, adjustment breakdowns, and confidence scoring.

2. Cost Approach Replacement Cost Method
The cost approach asks what it would cost to recreate the property's useful improvements today, then accounts for land value and depreciation. It becomes especially useful when the property is new, heavily damaged, unusual, or located where few reliable comparable sales exist. It shouldn't replace market evidence, but it can expose an ARV that depends on implausibly low or high construction assumptions.
A practical worksheet separates the property into components:
- Land value: Estimate the site independently from the improvements.
- Direct construction costs: Break the work into foundation, framing, roofing, mechanical systems, and finishes.
- Indirect costs: Include permits, design, financing, and project management where applicable.
- Depreciation: Deduct physical deterioration and functional or external obsolescence.
- Reconciliation: Compare the resulting indication with the sales-comparison estimate.
A fix-and-flip investor might use a property's estimated replacement cost to test whether a major rehab is economically rational. A hard money lender reviewing substantial structural repairs can compare the cost-based indication with the proposed loan and the market-supported ARV. A wholesaler can then subtract the verified repair scope and transaction costs before setting a maximum offer.
Turn the estimate into a downside test
The cost approach is only as reliable as its local inputs. National construction averages can hide regional labor, material, permitting, and site conditions. A line-item estimate should be checked against contractor bids, inspection findings, and the actual age and quality of the improvements. PropLab's construction cost estimator can help organize an initial rehab estimate, but local validation remains essential.
The cost approach is a boundary condition, not a permission slip to overpay.
A longer construction timeline also changes the investment decision. Carrying costs continue while the property is unavailable for sale or rent, and delays can reduce the margin even when the finished value is unchanged. Use the cost approach as a secondary check against comps, then decide whether the deal survives a wider scope, slower completion, or weaker exit price.

3. Income Capitalization Cap Rate Approach
An income valuation converts operating performance into a value indication. The basic relationship is:
Value = Net Operating Income ÷ Capitalization Rate
NOI should represent property income after normal operating expenses and before debt service. The cap rate reflects the return investors require for the property's income, risk, condition, location, and growth prospects. That makes this approach more relevant to buy-and-hold and BRRRR decisions than to a short renovation project.
Suppose an investor compares two rentals. One is priced at $200,000 and produces $18,000 of annual NOI, implying a 9% cap rate. The other costs $300,000 and produces $24,000 of NOI, implying an 8% cap rate. The first property appears stronger on current yield, but the difference doesn't settle the decision. The investor still needs to assess condition, rent durability, capital expenditures, financing, appreciation prospects, and exit liquidity.
The income model should show how NOI was built:
- Gross potential rent: Use market-supported rents, not aspirational asking rents.
- Vacancy and collection loss: Model tenant turnover and collection risk.
- Operating expenses: Include taxes, insurance, maintenance, management, utilities, and recurring services.
- Capital items: Separate recurring operations from major replacements.
- Capitalization rate: Explain the market evidence and risk adjustment behind the selected rate.
Stress the operating story
A cap rate can look attractive because the NOI is overstated. Verify rents against comparable rentals, inspect the expense history, and test lower rents alongside higher maintenance or insurance costs. If the cap rate falls below the property's borrowing cost, the financing structure may produce negative cash flow even when the unlevered valuation appears reasonable.
The investor's decision is therefore conditional. Buy when the property still meets the required return after realistic vacancy and expenses. Renegotiate when the price only works under optimistic rents. Pass when the operating margin disappears under modest stress.
4. After Repair Value for Fix-and-Flip Projects
After Repair Value estimates what a property could sell for after the planned renovation is complete. It isn't the value of the property today, and it isn't a substitute for a defined scope of work. ARV only becomes useful when the finished condition, buyer profile, market segment, and comparable set are aligned.
A wholesaler might use PropLab to estimate a renovated value of $350,000 for a distressed property, then evaluate an offer after accounting for $80,000 of repairs and a 20% profit margin. The arithmetic is less important than the discipline behind it. If the selected comparables reflect luxury renovations while the budget supports basic finishes, the ARV is overstated before the offer is written.
Start with three scenarios:
- Conservative: Use weaker but still relevant adjusted sales and a narrower renovation scope.
- Moderate: Match the most probable finished condition to the strongest comparable evidence.
- Aggressive: Include only improvements that have credible support in the market, not every possible upgrade.
The scope should identify kitchens, bathrooms, systems, exterior work, permits, and unresolved condition risks. A kitchen upgrade that costs more than the value it adds can destroy the spread even when the completed property looks better.

Use confidence to change the offer
A low-confidence ARV should lead to a wider margin and more conservative financing. A high-confidence estimate can support a tighter decision, but it still needs current comparable evidence and contractor validation. Revisit the model if the project extends, because market conditions, carrying costs, and available comparable sales can change during construction.
ARV is an exit assumption. The offer must survive if that assumption is wrong.
A lender can use ARV to assess collateral, but the investor should use it to determine whether the entire project remains viable. If the conservative scenario fails after repairs, holding costs, selling costs, and financing, the deal isn't ready for an aggressive offer.
5. Maximum Offer Price and Cash-on-Cash Return Analysis
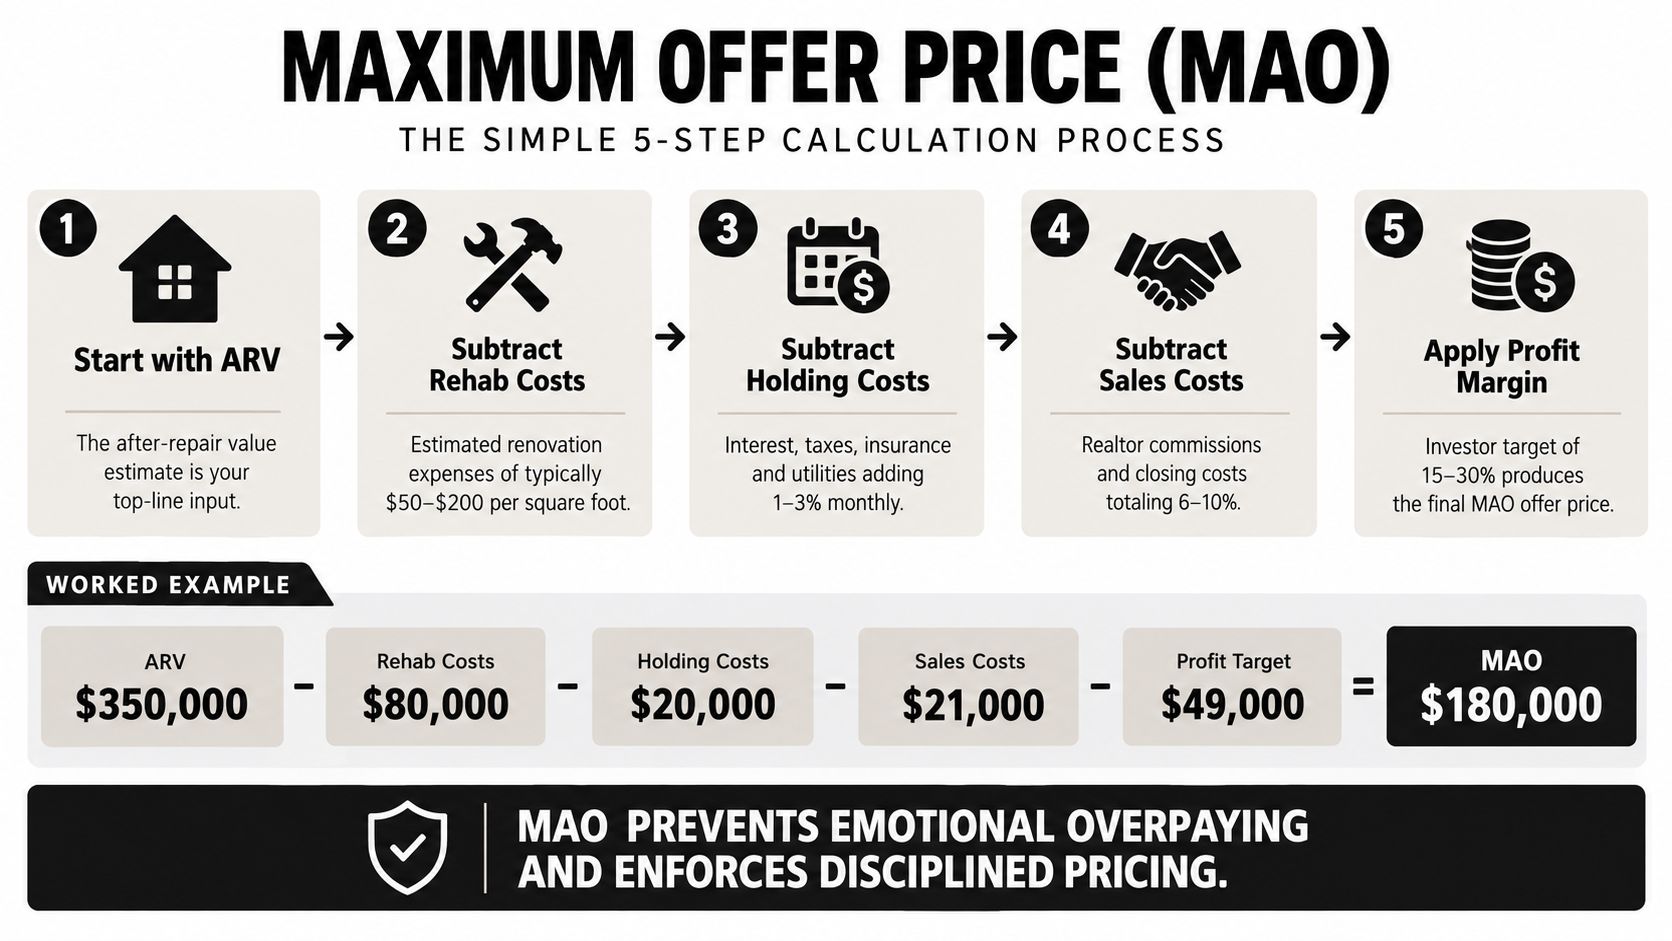
Maximum Offer Price works backward from the desired outcome. A simplified flip worksheet is:
MAO = ARV − Repairs − Holding Costs − Sales Costs − Profit Target
Consider the following spreadsheet-style example:
- ARV: $350,000
- Rehab: $80,000
- Holding costs: $20,000
- Sales costs: $21,000
- Profit target: $49,000
- MAO: $180,000
The output isn't a prediction of what a seller will accept. It's the price ceiling that protects the project assumptions. If the seller asks $240,000, the investor can explain why the offer doesn't work rather than allowing the asking price to set the underwriting.
Cash-on-cash analysis serves a different decision. It compares annual pre-tax cash flow with the investor's cash invested, making it useful for rental acquisitions and BRRRR holds. A project can meet a flip MAO rule but fail the hold test if debt service, reserves, vacancy, and operating costs leave little distributable cash.
Make every deduction visible
Holding costs include more than interest. Taxes, insurance, utilities, maintenance, management overhead, and delays all affect the result. Sales costs also deserve an explicit line because commissions, closing expenses, concessions, and staging can reduce proceeds. The investor should run the model with a conservative margin first, then revise it only when completed projects in the same market support the assumptions.
PropLab can automate the MAO calculation by combining ARV, repairs, transaction costs, holding costs, and the required profit margin. Its report format also gives partners and lenders a clearer basis for reviewing the offer.
Update MAO when financing terms, comparable sales, rehab findings, or the expected timeline changes. A price that worked last week may no longer protect the target return after a new inspection result or a weaker exit scenario.
6. Discounted Cash Flow and Net Present Value Analysis
A DCF model values the timing of cash, not just its total amount. Each projected cash flow is converted to present value using:
PV = Cash Flow ÷ (1 + r)^t
Here, r is the discount rate and t is the number of years. The NIST discounted-cash-flow example assumes an initial investment of $1,000, inflows of $750 after year 1 and $850 after year 2, and an 8% discount rate. The discounted inflows are approximately $694.44 and $728.05, totaling about $1,422.49. Dividing that total by the initial investment produces a profitability index of approximately 1.42.
The real-estate version follows the same logic. Forecast rental income, operating costs, refinancing proceeds, sale proceeds, and capital expenditures by period. Discount each net cash flow, add the present values, and compare the result with the investment required today.
A DCF doesn't remove uncertainty. It makes the assumptions visible enough to challenge.
A BRRRR investor can compare properties with different combinations of initial cash needs, rent growth, refinancing proceeds, and sale value. A buy-and-hold investor can model a longer hold and compare the present value of operating cash flow with the value of an earlier exit. A lender can inspect whether the refinance or sale is doing too much work in the projected return.
The NIST example also shows the direction of sensitivity. Raising the discount rate lowers present value, while increasing or accelerating cash flows raises it. That is why the investor should test slower rent growth, higher expenses, larger capital expenditures, and a weaker exit instead of relying on one polished forecast.
For a more structured worksheet, the commercial real estate valuation calculator guide can complement a transparent spreadsheet. The cash-flow forecasting guide from Allied Tax Advisors provides additional context for organizing projected inflows and outflows.
A short visual walkthrough can help investors connect the formula to a project-level decision.
7. Loan-to-Value and Loan-to-Cost Ratio Analysis
LTV and LTC translate valuation into borrowing capacity. LTV compares debt with property value, while LTC compares debt with the total project cost or another defined cost basis. Lenders use these ratios alongside collateral quality, borrower experience, liquidity, reserves, and the exit plan.
A hard money lender offering 70% LTC on a $150,000 purchase plus $80,000 of rehab would size the loan at $161,000 under that stated structure. If the completed property is valued at $350,000, a lender using 75% LTV would support a loan of $262,500 against the finished value. Those outputs aren't interchangeable. LTC controls exposure during construction, while LTV controls exposure against the completed or current asset value.
A BRRRR investor may also model a refinance at 75% LTV of a stabilized $400,000 value, producing a potential loan of $300,000 before lender-specific deductions, reserves, and closing costs. The refinance only works if the property qualifies at the new valuation and the resulting debt service is supported by income.
Underwrite the lender's version of value
Before shopping for properties, identify how the lender defines purchase price, rehab costs, completed value, and eligible expenses. Some lenders fund only part of the renovation budget, require interest reserves, or impose property-type and market restrictions. A lower LTV or LTC assumption can reveal whether the investor has enough cash to complete the project.
The decision is structural. If the deal works only at the maximum loan amount advertised, it may not work after an appraisal shortfall, change order, reserve requirement, or delayed draw. Model the lower proceeds first, then evaluate whether the investor can still reach the exit without adding expensive capital.
8. Debt Service Coverage Ratio for Rental Income
DSCR tests whether property income can cover annual debt service:
DSCR = NOI ÷ Annual Debt Service
A rental with $24,000 of NOI and $18,000 of annual debt service has a 1.33 DSCR. That means the property generates more operating income than the scheduled debt obligation, but the cushion still depends on whether NOI includes realistic vacancy, maintenance, insurance, taxes, and management costs.
A BRRRR refinance can produce a different result after stabilization. If the property generates $30,000 of NOI and the proposed loan requires $20,000 of annual debt service, DSCR becomes 1.5. The investor should compare that result with the lender's actual underwriting requirements and then test the ratio under weaker rent or higher expense assumptions.
The most useful stress test changes NOI rather than admiring the baseline. A property with a 1.40 DSCR falls to 1.12 when NOI is reduced by 20%, which signals materially less protection for the lender and owner. The model should show which line causes the decline, whether rent is too optimistic, expenses are incomplete, or debt terms are too aggressive.
Make DSCR a monitoring metric
Track the ratio after acquisition, not only during loan approval. A declining DSCR can indicate rising insurance, taxes, repairs, vacancies, or weakening rents. Portfolio managers can use the trend to identify properties that need expense controls, rent repositioning, refinancing analysis, or a sale decision.
A passing DSCR today isn't a guarantee of a safe hold. It is a starting point for testing tomorrow's operating conditions.
Use full operating expenses and a vacancy assumption instead of treating every collected dollar as NOI. Then compare the stressed ratio with the lender's minimum and with the owner's preferred cushion. If the property only qualifies under perfect occupancy and stable costs, the financing may be technically available but economically fragile.
Comparison of 8 Valuation Models
| Method | Implementation Complexity 🔄 | Resource Requirements 💡 | Expected Outcomes / Reliability ⭐📊 | Ideal Use Cases 📊 | Key Advantages ⚡ |
|---|---|---|---|---|---|
| Comparable Sales (Comps) | Low–Medium: select 3–5 comps, adjust systematically | MLS/public records, recent sales data, adjustment rules | High where comps are abundant; ⭐⭐⭐⭐ | Standard residential ARV, fix‑and‑flip verification, lender review | Reflects real transactions; transparent and widely accepted |
| Cost Approach (Replacement Cost) | Medium: separate land/building, estimate depreciation | Construction cost databases, contractor quotes, regional adjustments | Moderate reliability; strong as a valuation ceiling; ⭐⭐⭐ | New builds, heavily damaged or unique properties, rehab-heavy deals | Anchors rehab costs to market reality; prevents over‑rehab |
| Income Capitalization (Cap Rate) | Medium–High: accurate NOI calc and market cap selection | Rent comps, expense data, market cap sources (CoStar, brokers) | High for income assets but sensitive to NOI/cap rate; ⭐⭐⭐⭐ | Buy‑and‑hold, BRRRR, multifamily acquisitions | Directly links price to cash flow; comparable across markets |
| After Repair Value (ARV) | Medium: requires precise rehab scope + renovated comps | Rehab scope, renovated comps, contractor validation | High for flips when scope/comps reliable; fast with automation; ⭐⭐⭐⭐ | Fix‑and‑flip, wholesalers, bridge‑loan underwriting | Determines deal feasibility quickly; drives MAO and profit targets |
| Maximum Offer Price (MAO) / Cash‑on‑Cash | Low–Medium: backward financial calc from ARV | ARV, rehab and holding costs, sales costs, profit target | High for disciplined offers; sensitive to input accuracy; ⭐⭐⭐ | Offer pricing, deal filtering, wholesaler/investor negotiations | Prevents emotional overpaying; enforces repeatable discipline |
| Discounted Cash Flow (DCF) / NPV | High: multi‑year projections, discounting, sensitivity analysis | Detailed cash‑flow forecasts, discount rate assumptions, terminal value | Most comprehensive for long‑term value; highly assumption‑sensitive; ⭐⭐⭐⭐ | BRRRR, buy‑and‑hold, portfolio scenario comparison | Captures full wealth‑building picture; compares different hold strategies |
| Loan‑to‑Value (LTV) & Loan‑to‑Cost (LTC) | Low: straightforward ratio calculations | Current value or total project cost, lender criteria | High utility for financing decisions; ⭐⭐⭐ | Financing structure, lender qualification, development financing | Standard lender metric; quick assessment of leverage and terms |
| Debt Service Coverage Ratio (DSCR) | Low–Medium: NOI vs. debt service calc | Accurate NOI inputs, loan amortization schedules | Strong predictor of repayment capacity; ⭐⭐⭐⭐ | Refinance underwriting, permanent financing, portfolio stress tests | Directly measures debt‑service safety; aligns with lender underwriting |
Turn the Model Into a Repeatable Decision
A valuation model earns its place in an underwriting process only when it changes a decision. Start with the method that matches the strategy. A fix-and-flip investor usually needs comparable sales, a defined rehab scope, ARV, MAO, and financing limits. A rental investor needs market-supported income, operating expenses, cap rate, DCF, and DSCR. A lender may need all of them to understand collateral, project cost, repayment capacity, and exit risk.
Document every input. Record the sale date, condition, location, legal characteristics, and adjustments for each comparable. Separate purchase costs, rehab, holding costs, selling costs, financing, reserves, and profit assumptions. For income properties, show how rent, vacancy, taxes, insurance, maintenance, management, capital expenditures, and debt service produce the final NOI and coverage ratio.
Cross-check the central value instead of trusting one output. Compare ARV with adjusted sales and, where appropriate, the cost approach. Compare a cap-rate indication with DCF results and debt-service capacity. If the models disagree, don't average them mechanically. Investigate which assumption creates the gap, then decide whether the evidence supports a narrower range or a more conservative offer.
Stress-test the variables that can change the decision:
- Comparable quality: Remove weaker sales and see whether the value still holds.
- Renovation scope: Add unresolved repairs and test a delayed completion.
- Exit price: Use a lower ARV or weaker sale proceeds.
- Operating income: Reduce rent and increase vacancy or expenses.
- Financing: Model lower proceeds, higher debt service, and additional reserves.
- Timing: Extend the hold or construction period and recalculate present value.
A spreadsheet remains valuable because it exposes assumptions and makes revisions easy. PropLab can complement that process when faster comp selection, rehab estimation, ARV confidence scoring, MAO calculation, and shareable reports are useful. Its reports can bring comparable evidence, adjustment details, valuation ranges, supporting signals, and offer calculations into a format that partners and lenders can review.
Finish each underwriting pass with a clear action. Verify the comps. Define the scope. Include every cost. Test downside cases. Confirm the financing limits. Update the model when market conditions or project facts change. The final output shouldn't be a single impressive number. It should state the offer you can make, the capital you need, the risks you accept, and the conditions under which you'll walk away.
PropLab helps real estate investors select relevant comparable sales, estimate ARV and rehab costs, calculate MAO, and create offer-ready reports with supporting evidence. Use PropLab to turn the valuation model examples in this guide into faster, shareable underwriting workflows for your next acquisition.
About the Author
P
PropLab Team
Real Estate Analysis Experts
The PropLab team consists of experienced real estate investors, data scientists, and software engineers dedicated to helping investors make smarter decisions with AI-powered analysis tools.
Free tool
Get the ARV of any property in 30 seconds
Skip the spreadsheet. Enter an address and get an after-repair value backed by real comps.
