General
ATV Value Calculator: How to Estimate What Your ATV Is Worth
October 13, 2026
15 min read
You're standing beside an ATV you might sell, trade, or buy, and the first question is deceptively simple: what's it worth? An online estimate gives you a number in seconds, but that number may ignore engine hours, frame stress, title status, local demand, or the difference between an asking price and an actual sale.
A useful ATV value calculator should work more like a disciplined appraisal. It gathers the machine's identity and usage history, checks comparable sales, applies condition adjustments, and returns a range with a confidence level. That approach won't eliminate uncertainty, but it gives you a figure you can defend when a buyer makes an offer or a dealer presents a trade-in value.
Why Pricing an ATV Is Harder Than It Looks
A seller may enter the make, model, and year into a calculator, see a result, and list the ATV at that price. Then a buyer points out worn tires, missing service records, or a branded title. A dealer may offer less because the machine needs inspection, transport, preparation, and resale risk. None of those reactions necessarily means the calculator was useless. They show that market value depends on context.
Kelley Blue Book's powersports valuation approach illustrates the foundational inputs: make, model, model year, mileage or usage, condition, location, seasonality, and observed market prices. Its online ATV coverage includes utility and sport models manufactured after 2000, and the methodology considers factors such as geography, time of year, historical trends, and economic conditions. See the Kelley Blue Book ATV pricing reference for the type of information a credible calculator should collect.
Practical rule: A calculator should produce a range, not pretend one fixed price is correct for every region and every machine.
The difference matters in three situations:
- Selling: An inflated number leaves the ATV sitting while realistic listings attract buyers.
- Trading: A low trade-in offer can look reasonable only because the seller hasn't separated wholesale convenience from private-party value.
- Buying: A low price may reflect hidden mechanical or title problems rather than a bargain.
A defensible process is straightforward. Confirm the exact ATV, gather hours and records, find comparable transactions, adjust for condition and equipment, then read the final range alongside its confidence score. If the machine is beyond economical repair, valuation also needs an end-of-life plan. Guidance on hazardous waste rules for end-of-life vehicles can help owners understand disposal responsibilities before treating a damaged ATV as an ordinary used vehicle.
The Inputs Every ATV Value Calculator Needs
Bad inputs produce a polished but unreliable answer. Before calculating anything, identify the machine precisely and separate facts you can verify from assumptions supplied by a seller.
Start with the make, model, trim, model year, engine size, and drivetrain. A base utility ATV isn't automatically comparable with a premium trim from the same model family. Two machines with similar bodywork can differ in engine output, 4WD equipment, suspension, transmission, winch fitment, or factory accessories.
Build the identity record first
Use the VIN, frame label, title, owner's manual, and service paperwork to confirm the identity. The VIN can resolve uncertainty about year and model, while the hour meter or odometer establishes usage. If the model label is damaged, don't guess from appearance alone. Parts compatibility can change across model years, so this guide to motorcycle year and model fitment is useful context when the identification is unclear.
Record these essentials:
- Must-have facts: Make, model, trim, model year, engine size, drivetrain, hours or mileage, location, title status, and observable condition.
- Strong supporting facts: Service records, tire age, recent repairs, inspection notes, included accessories, and photographs of the frame and drivetrain.
- Nice-to-have facts: Original purchase documents, factory build details, and a complete accessory history.
Location affects the available buyer pool and local demand. Seasonality matters too. A work-oriented ATV may attract different buyers from a sport machine, while a unit equipped for snow or property maintenance may be more useful in some markets than others.
If a value is missing, mark it as unknown instead of filling the gap with a guess. A calculator should lower confidence or widen the range when hours, title status, or maintenance evidence cannot be verified. For a broader example of structured input-based valuation, compare the real estate offer calculator, where the quality of the output also depends on the quality of the property inputs.
How Depreciation Actually Works for ATVs
Depreciation gives you a starting frame, not a final price. Recent powersports analysis places average used-vehicle depreciation at roughly 10% to 15% per year, with a two- to three-year-old machine commonly retaining about 70% to 80% of its original value. Those figures are useful for sanity checking, but they hide major differences between youth, sport, utility, and premium machines. The underlying market analysis is available in this used powersports pricing guide.
Segment price bands make the limitation clear. The same analysis lists 50cc youth models at $800 to $1,500, while 700cc-plus ATVs range from $6,000 to $8,500. A flat percentage applied across both groups would confuse age with demand, equipment, intended use, and replacement cost.
Use the curve as a check
Depreciation guidance places first-year losses around 15% to 25%, later years around 10% to 15%, and years four through five around 5% to 8%. Premium brands may retain roughly 55% to 65% of original MSRP after five years, but these are benchmarks rather than promises. The source for those benchmarks also reports that Black Book recorded ATV values rising 0.3% through Q4 2025 after more persistent depreciation during 2024. Those market movements show why a calculator needs a data date rather than treating depreciation as timeless.
A 2024 machine with low hours, a clean title, documented servicing, intact plastics, and working 4WD may sit near the upper end of its segment. An older machine with heavy use, frame damage, neglected maintenance, or missing documentation can fall below a simple age-based estimate.
Use depreciation in three ways:
- Establish a broad baseline from original price, age, and segment.
- Check the result against current comparable sales.
- Replace the baseline with evidence when good local comps exist.
The mistake is allowing a depreciation formula to outrank the market. Buyers don't pay for an abstract age curve. They pay for a specific ATV with specific wear, equipment, and risk.
Building Your Comps List the Right Way
Comparable sales separate a defendable valuation from a hopeful listing price. Start with the exact model family, then narrow the sample by trim, engine class, drivetrain, model year, usage, location, and condition. A 4WD utility ATV with documented service shouldn't be compared directly with a two-wheel-drive sport machine only because both carry the same brand badge.
Filter before you calculate
Good comparables share the traits that drive buyer decisions:
- Model family: Match the platform and trim as closely as possible.
- Age: Keep model years reasonably close unless the market offers too few examples.
- Usage: Separate low-hour machines from heavily used units.
- Condition: Remove neglected, damaged, or freshly rebuilt examples from clean-machine comparisons.
- Transaction type: Label dealer inventory, private-party asking prices, auction results, and completed sales separately.
Asking prices reveal seller expectations, not necessarily what buyers paid. Completed transactions carry more weight, but they still need context. An auction sale may reflect urgency, limited inspection, or an unusual buyer pool.
One dataset reported a $5,300 Yamaha median from 16 completed auction sales, with observed prices ranging from $1,500 to $29,999. That wide spread is precisely why a median and outlier controls beat a single listing. The figures and methodology are discussed in this vehicle valuation guide.
Work from the middle, not the extremes
Remove obvious mismatches first. Then group the remaining observations by condition and usage, and calculate a central range rather than grabbing the highest visible price. If only a few relevant observations remain, widen the confidence interval and say why.
A useful comp sheet should show:
- Listing or transaction date
- Source and transaction type
- Exact model and trim
- Hours or mileage
- Condition notes
- Included accessories
- Price
- Reason for excluding or weighting the observation
The same discipline applies in other valuation work, which is why a real estate comparables template emphasizes consistent fields rather than a collection of attractive but poorly matched listings. Your ATV worksheet doesn't need to be complicated. It needs to make every adjustment visible.
Applying Condition and Usage Adjustments
The comp median tells you where similar machines cluster. The inspection tells you whether your ATV belongs near the top, middle, or bottom of that cluster.
Hours deserve special attention. Available valuation guidance labels under 500 hours or 1,000 miles as low use and over 5,000 miles as heavy use, while noting that hours can matter more than age for off-road equipment. CV joints, bearings, suspension parts, frame members, and 4WD components can reveal hard use that an odometer doesn't capture. See the ATV valuation guidance on hours and wear for that usage framework.
| Condition or factor | Typical impact on estimate | Notes |
|---|---|---|
| Clean frame and documented service | Supports the upper part of the range | Buyers can verify structural integrity and maintenance |
| Low hours with functional systems | Supports a stronger estimate | Confirm the hour meter and inspect wear against the reading |
| High hours or heavy mileage | Pushes the estimate downward | Look for drivetrain, bearing, suspension, and frame stress |
| Working 4WD, suspension, and transmission | Protects marketability | Test operation rather than relying on a seller's description |
| Worn tires, cracked plastics, or rust | Reduces the estimate | Separate cosmetic wear from safety or structural concerns |
| Missing title or VIN documentation | Can materially reduce confidence and price | Treat paperwork risk separately from mechanical condition |
| Accessories and modifications | Add value only when comparable sales support it | Purchase cost doesn't equal resale value |
Translate inspection findings into adjustments
Check the engine for smoke, starting difficulty, leaks, unusual noise, and stable operation. Test the transmission under load. Engage 4WD, inspect CV boots, operate the suspension, and examine the frame for bends, cracks, or repairs. Tires and plastics matter, but a damaged frame or slipping transmission should carry far more weight than cosmetic upgrades.
Modifications are another common trap. A winch, plow, upgraded tires, storage box, or lighting package may improve usefulness, but buyers rarely reimburse the original purchase cost. Credit an accessory only when similar completed sales show that buyers pay more for it. Otherwise, record it as a selling feature without adding its invoice price to the valuation.
For a structured way to document condition observations, the property condition assessment guide offers a useful transferable habit: describe the observed issue, identify its likely effect, and separate evidence from opinion. The same method also helps when you compare Canadian used car values, where condition and market context can shift an estimate beyond a simple age calculation.
Turning Inputs and Comps into a Final Value Range
A practical output has four parts: a central estimate, a low and high range, an adjustment ledger, and a confidence score. The central estimate comes from the best-matched comps. The range reflects uncertainty in condition, usage, market timing, and sample size.
Consider a hypothetical 2024 Can-Am Outlander 570. Recent market analysis lists a new 2026 example at approximately $8,499 MSRP, while a comparable 2024 used example is estimated at $6,200 to $6,800 before adjustments for mileage, accessories, location, and condition. The comparison appears in the powersports market analysis.
A worked range, not a pretend answer
Suppose the 2024 machine has verified low use, a clean title, service records, functional 4WD, strong tires, and no frame damage. Its evidence supports the upper part of that cited range. If the same model has high hours, worn tires, missing records, and uncertain drivetrain service, the estimate should move toward the lower end or below the clean-machine comparison set.
The workflow looks like this:
- Start with matched comps: Use completed transactions first and separate dealer asking prices.
- Set the midpoint: Use the median or a trimmed central range when outliers distort the sample.
- Apply condition adjustments: Record each positive or negative factor separately.
- Check depreciation: Make sure the result isn't wildly inconsistent with the machine's age and segment.
- Widen uncertainty: Expand the range when the sample is small or important data is missing.
The final report might say, in plain language, that the estimate is strongest when the hour meter, title, and service history are verified. It shouldn't hide uncertainty behind a precise-looking figure.
Let market timing influence confidence
Seasonality can change buyer activity and local availability. Market direction also matters. As noted in the earlier analysis, Black Book reported ATV values rising 0.3% through Q4 2025 after earlier depreciation. That doesn't justify automatically increasing every estimate. It does justify checking the date of each comparable and avoiding stale pricing evidence.
A high-confidence result has several close comps, verified hours, clear condition notes, and a clean title. A low-confidence result relies on asking prices, uncertain identity, missing records, or a broad geographic search. The calculator's job is to show that difference clearly.
Common Mistakes That Quietly Skew ATV Values
Most bad ATV estimates don't fail because the owner can't subtract depreciation. They fail because the owner feeds the calculator weak evidence or treats one visible feature as the whole story.
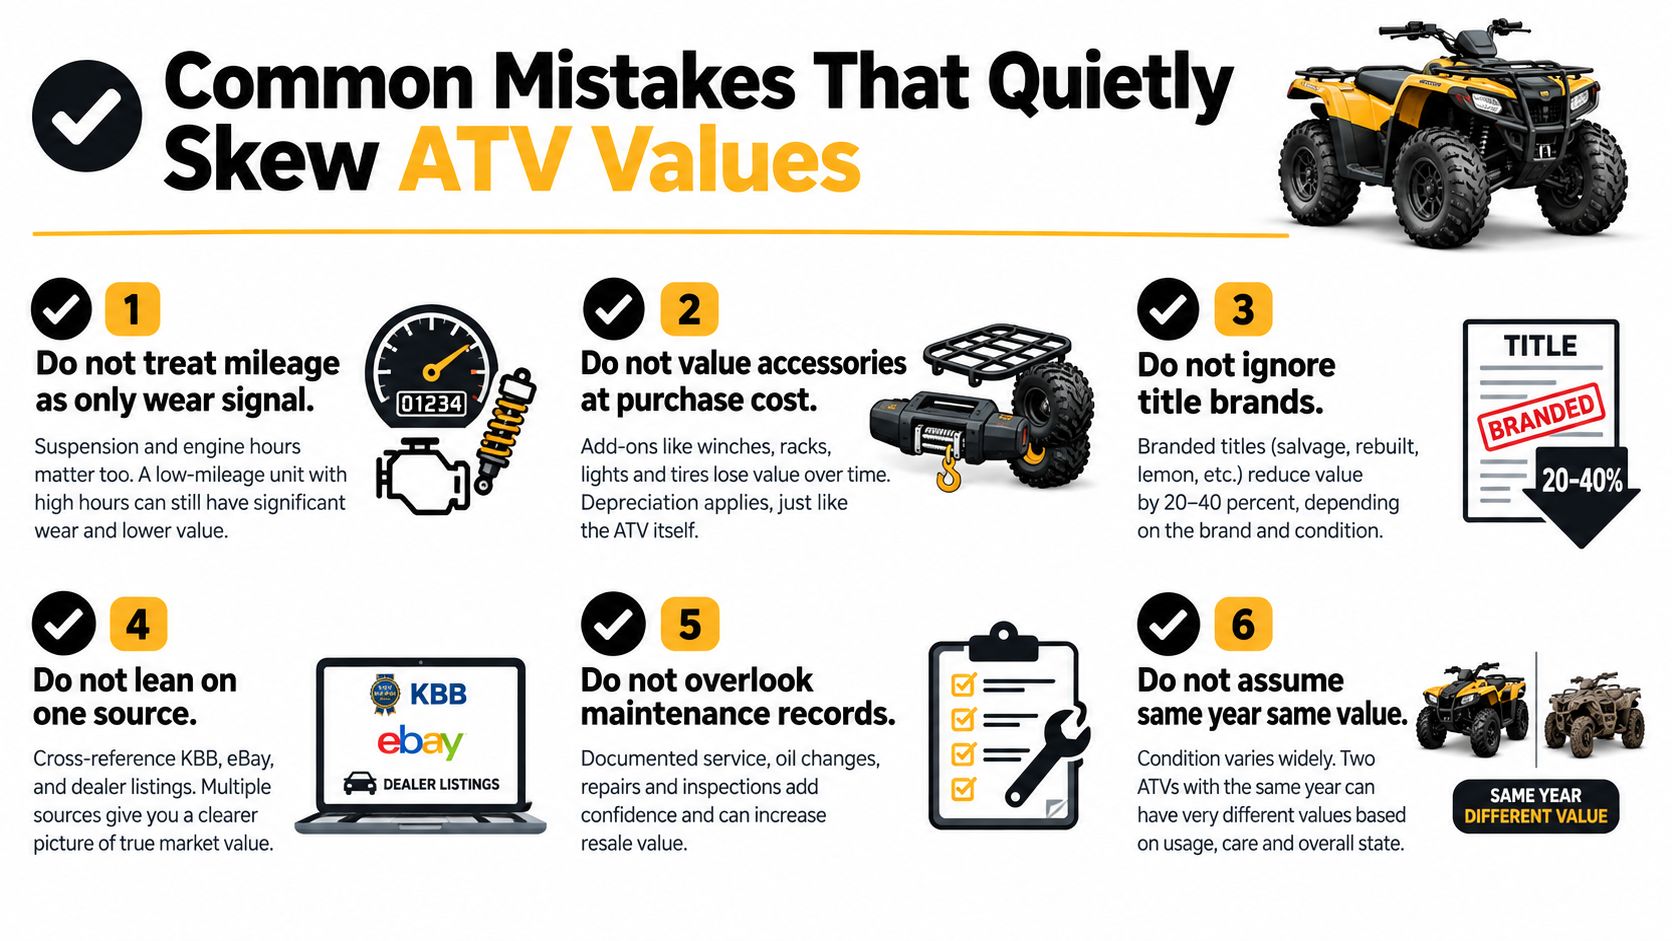
Mileage isn't the complete wear record
Road vehicles often make mileage the headline measure. Off-road machines can experience high-load, low-speed work, mud, water, towing, and repeated impacts that mileage doesn't describe well. Engine hours, service records, CV joints, bearings, suspension components, and frame condition may tell you more.
Use mileage when it's available, but pair it with hours and a mechanical inspection. If the hour meter is missing or questionable, lower confidence rather than assuming average use.
Accessories don't retain their purchase price
A seller may add the original cost of a winch, tires, plow, or storage system to the ATV's value. Buyers usually evaluate whether the equipment is useful, functional, and already included in comparable machines. They don't automatically reimburse the first owner for every modification.
Record accessories separately. Then look for evidence that similar equipped ATVs sell for more. If no evidence exists, describe the equipment as a marketability benefit rather than a guaranteed dollar adjustment.
Paperwork risk changes the deal
A missing VIN record, unclear title, or branded title can reduce the buyer pool and make financing or registration more difficult. Don't bury that risk inside a generic condition grade. List title status as its own adjustment and explain how it affects confidence.
A clean machine with uncertain paperwork isn't equivalent to a clean machine with verified documents. The mechanical inspection may look excellent while the transaction remains difficult.
One listing isn't a market
The highest visible listing is often the least reliable anchor. It may be aspirational, unusually equipped, geographically isolated, or merely unsold. One low auction result can be just as misleading if the sale involved urgency or damage.
Use several closely matched observations, favor completed sales, and show dispersion. The Yamaha example discussed earlier demonstrates why a median is more useful than a dramatic high or low result.
Same year doesn't mean same value
Two ATVs with the same model year can have very different prices because one has low verified hours and careful maintenance while the other has frame repairs, worn drivetrain parts, or heavy commercial use. Regional demand also changes what buyers consider desirable.
Save this checklist for the next valuation:
- Identify the machine: Confirm make, model, trim, year, engine, drivetrain, VIN, and title.
- Document use: Record hours, mileage, service history, and evidence of hard work.
- Build matched comps: Separate completed transactions from asking prices and filter by condition.
- Apply depreciation as a check: Don't let a generic age percentage replace market evidence.
- Inspect the important systems: Engine, transmission, 4WD, frame, suspension, tires, plastics, and bearings.
- Adjust transparently: Record every positive and negative factor instead of hiding it in one score.
- Report confidence: Widen the range when records, hours, or good comps are missing.
- Re-run the estimate: Update the result when the market, season, or machine condition changes.
The calculator should be a starting point for a decision, not a verdict. A seller can use the range to set a credible asking price, a buyer can use it to challenge a weak deal, and a dealer can explain why trade-in value differs from private-party value.
For the same evidence-first approach in property investing, PropLab identifies relevant comps, breaks down adjustments, and produces confidence-scored valuation reports for faster offer decisions. Visit PropLab to turn scattered market data into a clear, defensible analysis you can share with partners and lenders.
About the Author
P
PropLab Team
Real Estate Analysis Experts
The PropLab team consists of experienced real estate investors, data scientists, and software engineers dedicated to helping investors make smarter decisions with AI-powered analysis tools.
Free account
Underwrite your next deal in under a minute
3 free analyses, no credit card. ARV, rehab, comps and exit strategy in one report.
