General
Deal Analysis Real Estate: ARV, Repairs and Max Offer
November 17, 2026
18 min read
The advice you hear on every flip podcast is that a deal comes down to one line of arithmetic. Take the after repair value, multiply by 70%, subtract the repair estimate, and you have your maximum offer. It's tidy, it's repeatable, and it's the reason so many investors sign contracts that look profitable on a napkin and lose money over six months.
That number isn't an answer. It's a hypothesis, and the work is in trying to break it before you're committed. I treat the maximum offer as the output of seven separate calculations, then I run the whole thing through a few plausible downside scenarios to see how far it can drift before the profit disappears. If the offer survives a 10% ARV drop and a repair overrun, it's a deal. If a bad month on the comps wipes out the margin, it's a pass dressed up as a project.
Here's how I walk a colleague through a deal on paper, including the parts where the arithmetic gets uncomfortable.
The Deal Analysis Worksheet at a Glance
Start with the number that makes flipping look easy. In the United States, the typical flipped property sold for a median $315,000 in 2024 while investors had paid a median $243,000, producing a gross profit of roughly $72,000 and a 29.6% gross return on the purchase price, according to ATTOM's 2024 year-end home flipping report. That report covered 297,885 flipped single-family homes and condominiums, so the sample is broad.
The catch sits in what the 29.6% excludes. It leaves out financing, property taxes, insurance, renovation, utilities, selling costs and holding time. Once those appear, a deal that looked like a 29.6% winner turns into an ordinary one, and occasionally a loss. The same measure peaked at 54.2% in 2016, which tells you a market-wide gross return in the high twenties is normal rather than generous.
Gross spread isn't profit. It's the raw material profit gets built from, and the build is what most underwriting skips.
Every deal I screen goes into the same seven-row worksheet, in the same order. The benchmarks below come from the sample worked through later in this piece, so the scale is visible.
| Component | How to calculate | Typical benchmark |
|---|---|---|
| After repair value (ARV) | Price the finished home would sell for, from sold comps | A range from recent similar sales; no fixed national price |
| Repair budget | Itemized scope of work plus contingency | 10-20% contingency on top of the base scope |
| Financing cost | Interest, points and fees over the holding period | Two points plus interest on the drawn balance; the sample below runs $12,000 |
| Holding costs | Monthly taxes, insurance, utilities and carry, times months held | Budget the slow schedule, not the fast one; six months is a fair baseline |
| Selling costs | Agent commissions, seller closing costs, concessions and staging | Often 6-10% of sale price; the sample uses 8% |
| Profit margin | Target net profit after every cost, set before the offer | 10-15% of ARV for a flip you intend to hold through a resale |
| Maximum offer price | ARV x 70% minus repairs, then cut if the net or stress test fails | $150,000 on a $300,000 ARV with $60,000 of repairs |
Why the Order Matters More Than the Formula
ARV goes first because every other row scales off it. A 5% error in resale value moves the repair allowance, the selling cost and the profit floor at the same time. Repairs come second because they're the row you control and the row most likely to change after demolition. Operating costs come third, and they're the row investors most often underestimate, because they run per month rather than per project.
Profit comes near the end, and the maximum offer comes last. That sequence is the whole discipline. When the offer drives the assumptions, you get a price that confirms what you already wanted to pay.
Practical rule: If a row in the worksheet has no document behind it, treat that as an open risk, not a rounding error. An arbitrary $5,000 for permits isn't conservative, it's unknown.
Fill in all seven rows for a property before you run any other analysis on it. The rows you can't source are the ones that decide whether the deal is real.
Estimating After Repair Value From Comparable Sales
The most common comp-selection mistake isn't laziness, it's optimism with a straight face. Someone pulls the two highest sales on the street, ignores the dated kitchen next door, and calls the result an ARV. That number then flows into the offer, the lender package and the profit projection, and nobody questions it because it came from the MLS.
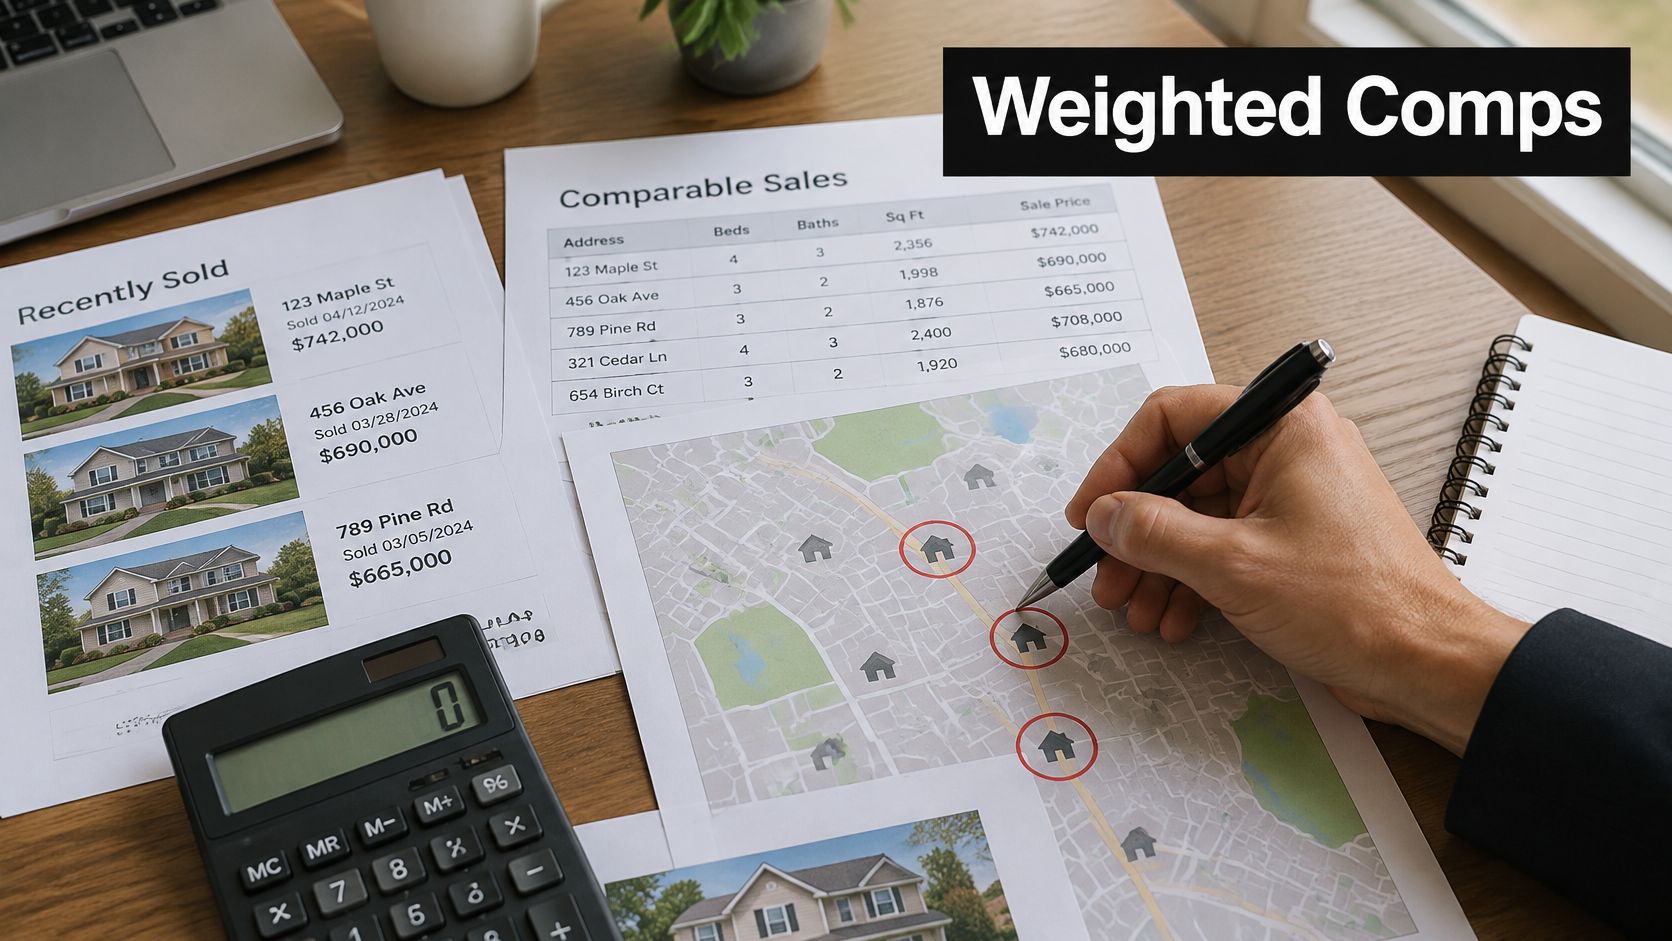
An ARV is a weighted read of nearby evidence. Not a listing price, not a neighbor's opinion, not a portal's estimate. Here's the process I use.
- Pick three to five sold comps, not listings. Keep the radius tight and the window recent, and match on square footage, bedroom count, age and condition before anything else. An active listing tells you what a seller hopes for. A closed sale tells you what a buyer paid.
- Adjust each comp in dollars for what differs. An extra bathroom, a garage, a larger lot, a finished basement or a dated kitchen each carries a line-item adjustment. Write them down. An adjustment you can't defend in a sentence is a guess.
- Weight by distance and recency. A sale from last month two streets over should carry more weight than a six-month-old sale across the highway. Recency matters more in a moving market, distance more in a mixed neighborhood.
- Check the spread. If the adjusted comps disagree by more than about 10%, you don't have an ARV yet. You have a range wide enough that the offer can't be set from it, and you need more evidence, a different comp set, or a pass.
Transaction volume explains why this analysis has to be fast without being sloppy. In the first quarter of 2024, 67,817 U.S. single-family homes and condominiums were flipped, 8.7% of all home sales nationally, and the typical flip produced $72,375 in gross profit on a median resale price of $312,375 against a median purchase price of $240,000, per ATTOM's first-quarter 2024 flipping report. That 30.2% gross return still sits before renovation, financing, taxes, insurance and commissions.
The national figure is a sanity check, nothing more. Local liquidity, neighborhood quality, property condition and how recent and similar your comps are will move the answer more than any national average can. When I'm checking whether a renovation will pay back at resale, resources like smart updates for Portland home sellers are a useful reality check on which upgrades buyers reward and which ones you absorb as a cost.
Write the ARV as a range with a midpoint, and be honest about what a weighted comp set can do. It's a valuation aid, not a licensed appraisal or a guaranteed forecast, and any automated figure, ours included, carries that same limit. If you want the mechanics of building an evidence-based comp set, this walkthrough of residential real estate comps covers the adjustment side in detail. Build the offer on the midpoint, then test the downside against the low end.
Repair Budgets and Financing Costs That Move the Offer
The repair-budget mistake that causes most overruns is a single number with no lines under it. "Rehab is fifty grand" means somebody walked the house for twenty minutes and guessed. It survives right up until the crew opens a wall and finds rot, knob-and-tube wiring or a foundation issue that was hiding behind drywall.
Build the budget trade by trade. Roof, HVAC, electrical, plumbing, kitchen, bathrooms, flooring and paint, each with its own quantity and unit cost. Then add permits, dumpster and labor as counted items inside the scope, not as a leftover you hope absorbs them. Any scope above a few thousand dollars gets at least two bids, and the bids get compared line by line rather than on the total.
On top of the base scope, carry a contingency of 10-20%. It isn't padding. It's the price of not knowing what's behind the walls, and after demolition you'll usually spend it.
Roofs deserve their own line because the range is enormous and the scope changes with material. A tile roof replacement cost guide is worth reading before you accept a single bid, since tile, asphalt and metal land in very different places and the structural work underneath can dwarf the covering itself.
Interest Accrues on What You've Drawn
Hard money is priced with interest plus points, where one point equals 1% of the loan amount. The mistake is calculating interest as if the whole loan were outstanding from day one. Rehab draws arrive in stages, so on a typical project you're carrying the full balance for only the last stretch of the schedule. Say a $150,000 loan at 12% runs for six months: that's about $9,000 in interest before points and fees, and less if the draws land late in the timeline.
Cash doesn't remove the cost, it relocates it. Your capital stays trapped in the project for the hold, and that opportunity cost belongs in the same column as the interest line. A deal that only pencils with cash is a deal that doesn't pencil.
| Line | How it is figured | Sample figure |
|---|---|---|
| Roof, HVAC, electrical, plumbing, kitchen, baths, flooring, paint | Itemized contractor scope; at least two bids above a few thousand dollars | $60,000 total across all trades on the sample |
| Permits, dumpster and labor | Counted in the scope, not left as a leftover | Inside the $60,000, never a separate surprise |
| Contingency | 10-20% of the base scope, held until demolition reveals condition | $6,000 to $12,000 on the sample |
| Hard-money interest | Rate applied to the drawn balance as draws arrive, not the full loan from day one | About $9,000 on $150,000 at 12% over six months |
| Points and lender fees | One point equals 1% of the loan amount, plus the written fee schedule | Two points on $150,000 is $3,000 |
| Cash purchase | Opportunity cost of tied-up capital replaces the interest line | No interest charge; capital stays in the project for the hold |
Three documents come before any offer: a line-item scope from a contractor who has walked the property, a lender's full fee schedule in writing, and a draw timeline. Without all three, the financing line is fiction. For a trade-by-trade breakdown of what each scope costs, this house renovation cost breakdown is a reasonable starting reference.
Holding, Selling and Insurance Costs That Erode Profit
The assumption I push back on hardest is that carry costs are small enough to round. They aren't, because they multiply by time, and time is the one input a flip never controls. Every month past your plan is another full set of bills with no new income arriving.
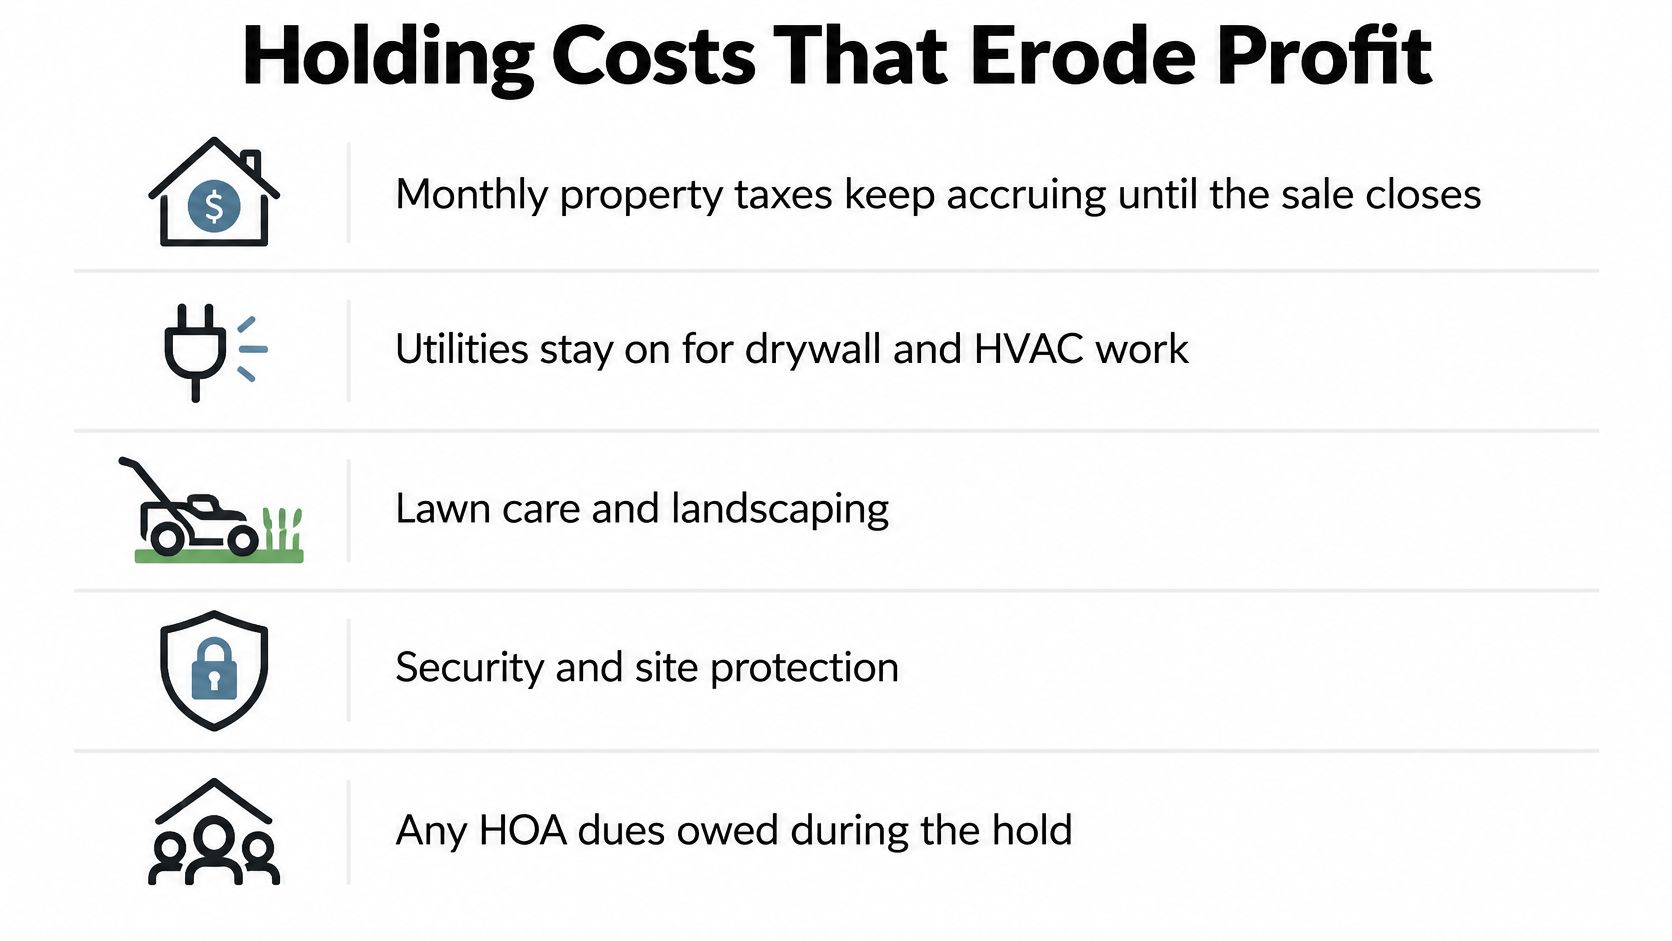
Holding costs run whether or not anyone is working. Property taxes accrue from the day you close. Utilities stay on so drywall can dry and HVAC can run. Lawn care and site security keep the property from looking abandoned, which matters for both theft and resale. Any HOA dues keep coming. Add those into a monthly figure and multiply by a realistic month count, not the schedule you'd like.
Insurance Is Where Deals Quietly Break
Insurance deserves its own row rather than a percentage of the purchase price. Mortgage holders in the U.S. paid a record $209 per month for property insurance in 2026, nearly 80% above the start of 2020, and coverage-limit increases accounted for roughly two-thirds of the latest annual increase, per the ICE Mortgage Monitor report on property insurance costs. Some metros moved far faster than the national average, including Greenville at +15.8%, Honolulu at +14.7%, Minneapolis at +13.1%, and Sacramento and San Diego at about +12%.
Four questions belong in the underwriting, and most calculators never ask them. Can the property be insured at all? What deductible and exclusions apply? Does the premium hold after a roof replacement or a change from vacant to occupied use? How do wildfire, flood, storm or liability exposures change the exit value?
A property with a good purchase price and a clean ARV can still be a bad deal if coverage is thin, the deductible is brutal, or no carrier will bind a policy on a vacant structure.
Before making an offer, verify each line with a document: taxes from the county assessor, insurance from a written quote rather than a rule of thumb, HOA dues from the association's current budget, utilities from the last twelve months of bills, and selling costs from your agent's commission schedule plus typical concessions in that price band. For the full stack of exit costs on a flip, this guide to the cost of flipping a house rounds out the list.
A Full Deal Worked From ARV to Net Profit
Numbers on a page only mean something when they're attached to a property. Take a house with an ARV of $300,000 and a repair budget of $60,000. The 70% rule gives $300,000 x 70% = $210,000, minus $60,000 in repairs, for a maximum purchase price of $150,000.
That's the number most investors stop at. Now add what the rule ignores.
Holding costs at $1,800 per month for six months come to $10,800. Financing for interest and two points is $12,000. Selling costs at 8% of ARV are $24,000. Total cost lands at $256,800, which leaves a net profit of $43,200, or 14.4% of ARV.
| Line item | Basis |
|---|---|
| ARV | $300,000, from adjusted sold comps |
| Purchase price | $150,000, from 70% of ARV minus repairs |
| Repairs | $60,000, itemized scope before contingency |
| Holding costs | $1,800 a month for six months, so $10,800 |
| Financing | $12,000, interest plus two points |
| Selling costs | 8% of $300,000, so $24,000 |
| Total cost | $150,000 + $60,000 + $10,800 + $12,000 + $24,000 = $256,800 |
| Net profit | $300,000 - $256,800 = $43,200, or 14.4% of ARV |
The 70% Rule Leaves Room for Profit, Not for Every Cost
Notice what happened. The formula produced a purchase price that leaves $43,200 of profit, which sounds healthy until you compare it with the gross figures the market reports. During the third quarter of 2024, typical U.S. flips generated a $70,250 gross profit and a 28.7% gross return before expenses, according to ATTOM's third-quarter 2024 home flipping report. Those are gross numbers. This sample's $43,200 is net of everything except the seller's own time, and it's the number that reaches a bank account.
Which brings up the step often skipped: set the profit target before you price the house. Put it as a dollar floor, a percent of ARV, or both, and write it down. On this sample, the $43,200 works out to 14.4% of ARV. If your target is $55,000, the gap is $11,200, and the purchase price drops to $138,800 before you run a single stress test.
Decide the target first. Then let the arithmetic tell you what you can pay.
Stress-Testing the Numbers Before You Offer
A single-point ARV, a single repair number and a single interest assumption describe a world that doesn't exist. The margin for error has compressed, too. McKinsey's real estate private markets report notes that higher financing costs, uneven rent growth and tighter underwriting standards are squeezing deal flexibility, while the gap between public-market real estate pricing and private-market appraisals sits at roughly 130 basis points. More than half of surveyed housing investors named financing costs as one of their biggest current problems, and three-quarters didn't expect near-term rate relief.
So test the sample against outcomes that could plausibly happen. None of these require a crash. They require an ordinary bad month.
| Scenario | Repairs (USD) | Net profit (USD) |
|---|---|---|
| Base case | 60,000 | 43,200 |
| ARV down 5% | 60,000 | 29,400 |
| ARV down 10% | 60,000 | 15,600 |
| Repairs 20% over budget | 72,000 | 31,200 |
| Two-month delay | 60,000 | 39,600 |
| ARV down 10% and repairs 20% over | 72,000 | 3,600 |
Repairs hurt less than resale value, and that surprises people. A 20% overrun costs $12,000 and still leaves $31,200. A 10% ARV miss costs $30,000 and leaves $15,600, because the loss hits the sale price and the 8% selling cost drops with it but not enough to matter. A two-month delay adds $3,600 and is the mildest of the four. Combine the ARV miss with the overrun and $3,600 is left, which is not a business, it's an expensive hobby.
Find the Break-Even ARV and Work Backwards
Set the net profit to zero and solve. Purchase of $150,000, repairs of $60,000 and $22,800 of holding plus financing cost $232,800 before selling costs. Selling costs of 8% mean the ARV has to cover that total plus its own commission, which puts break-even at roughly $253,000, a 15-16% drop from $300,000.
That's your real risk number, not the base case. If a 15% ARV slide is plausible in that submarket, the $150,000 offer is too high and the price needs to come down until break-even sits outside the plausible range.
The test I apply: if a downside I can describe in one sentence wipes out the target margin, the offer isn't finished. Lower it until the downside hurts without killing the deal.
Lenders should apply the same test. A deal with a positive base-case spread and a break-even ARV inside normal market noise is a rejection, not an approval with conditions.
Set Your Maximum Offer Before You Bid
Now turn the checked numbers into a bid or a pass. The order is fixed, and it finishes before you talk to the seller.
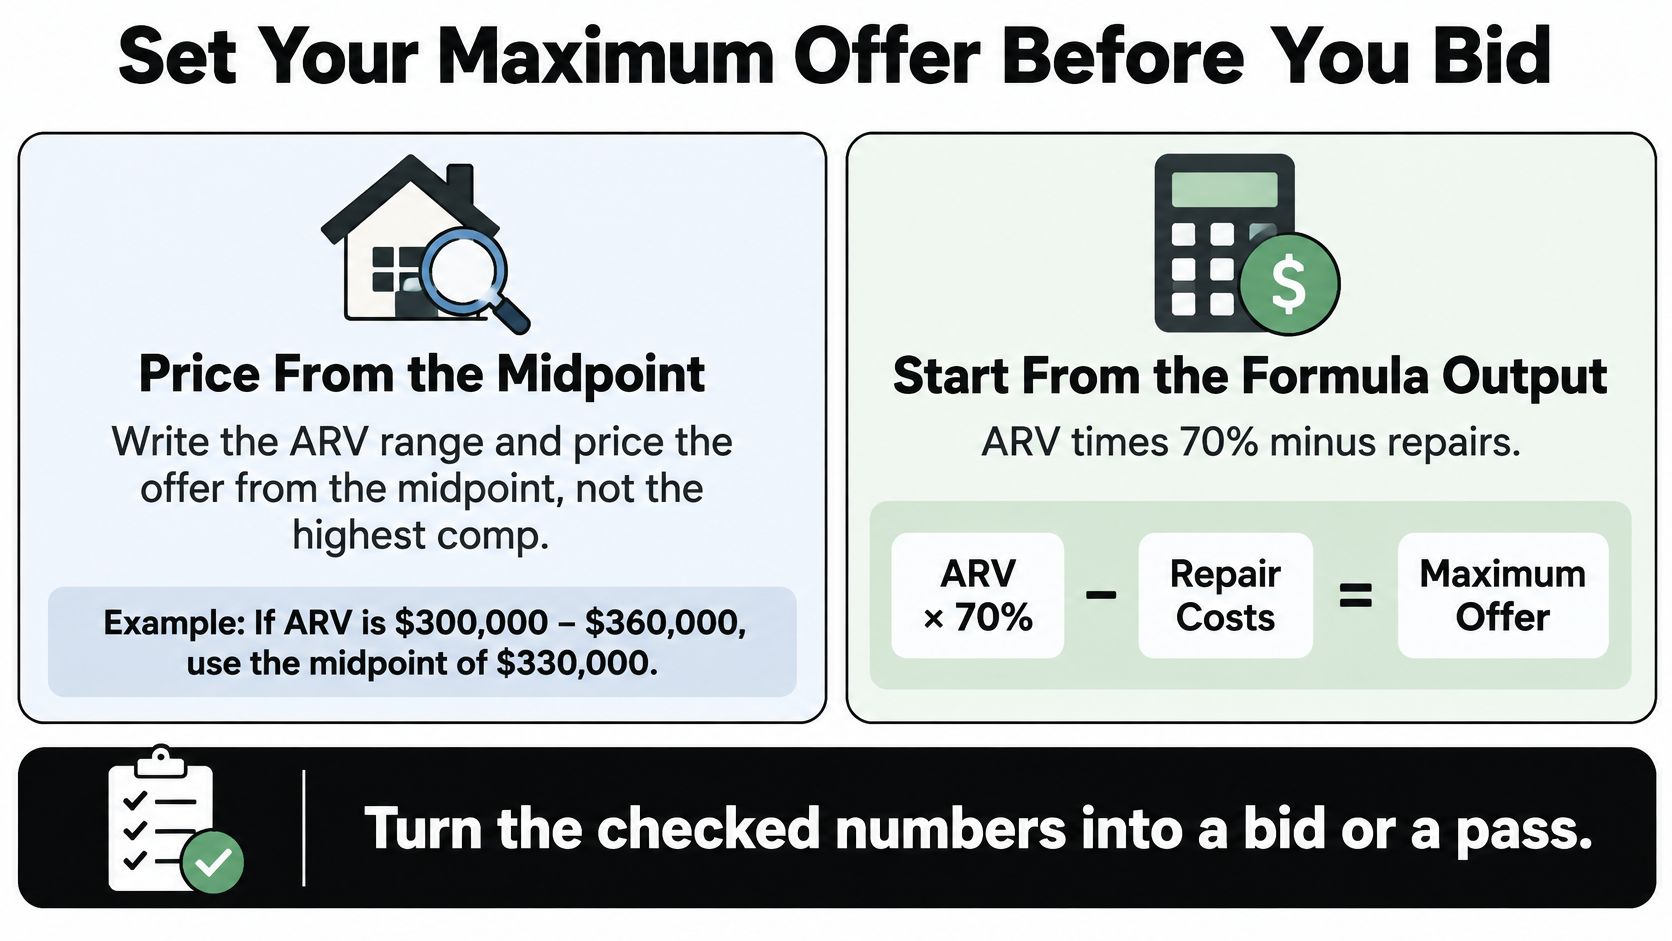
- Write the ARV range and price from the midpoint. Not the highest comp, not the agent's opinion of value. The midpoint of a weighted, adjusted comp set.
- Start from the formula output. ARV times 70%, minus repairs. On the sample that's $150,000 against $60,000 of work.
- Keep that price only if the net clears the target you set before the house was priced. The sample nets $43,200, or 14.4% of ARV. If your floor is higher, cut the offer by the shortfall now.
- Cut or walk when a plausible downside erases the margin. A 10% ARV drop plus a 20% overrun leaves about $3,600, and break-even sits near a $253,000 ARV, roughly a 15-16% slip.
- If the surviving price is below what the seller will take, walk. Handing back the margin to win a negotiation isn't a strategy, it's a donation.
Assemble the whole package into one file a partner or lender can read in ten minutes: comps with adjustments, the line-item scope, the lender fee sheet, the insurance quote and the scenario table. Software totals those lines faster than a spreadsheet, and a platform like PropLab builds the report from a pasted address with comps, ARV, rehab estimates and exit strategies in about a minute, but the package is a valuation aid rather than a licensed appraisal. The offer stays the investor's number, and the stress test is what makes it defensible.
PropLab is built for exactly this workflow: paste a property address or a Zillow, Redfin or MLS link and get back the comps, adjustments, ARV range, rehab estimate and a Max Offer Price that already accounts for repairs and a profit margin, plus a professional PDF you can send straight to a partner or a hard money lender. Before you make your next offer, run the deal through PropLab and stress the number while it's still cheap to walk away.
About the Author
P
PropLab Team
Real Estate Analysis Experts
The PropLab team consists of experienced real estate investors, data scientists, and software engineers dedicated to helping investors make smarter decisions with AI-powered analysis tools.
Free tool
Stop guessing rehab costs
Get a line-item renovation estimate from the property details — no contractor walkthrough needed.
