General
How to Find Rental Comps: A Step-by-Step Investor Guide
November 5, 2026
18 min read
You're looking at a duplex that pencils out beautifully at the rent in the listing notes. Then you pull real leases nearby and find tenants are paying far less once free months and included utilities are stripped out. That gap is where deals die, usually after you've paid for inspections. Good comp work isn't about grabbing the closest listing. It's about finding what a comparable tenant paid, on the same basis as your unit, and proving that number can survive a lender's questions.
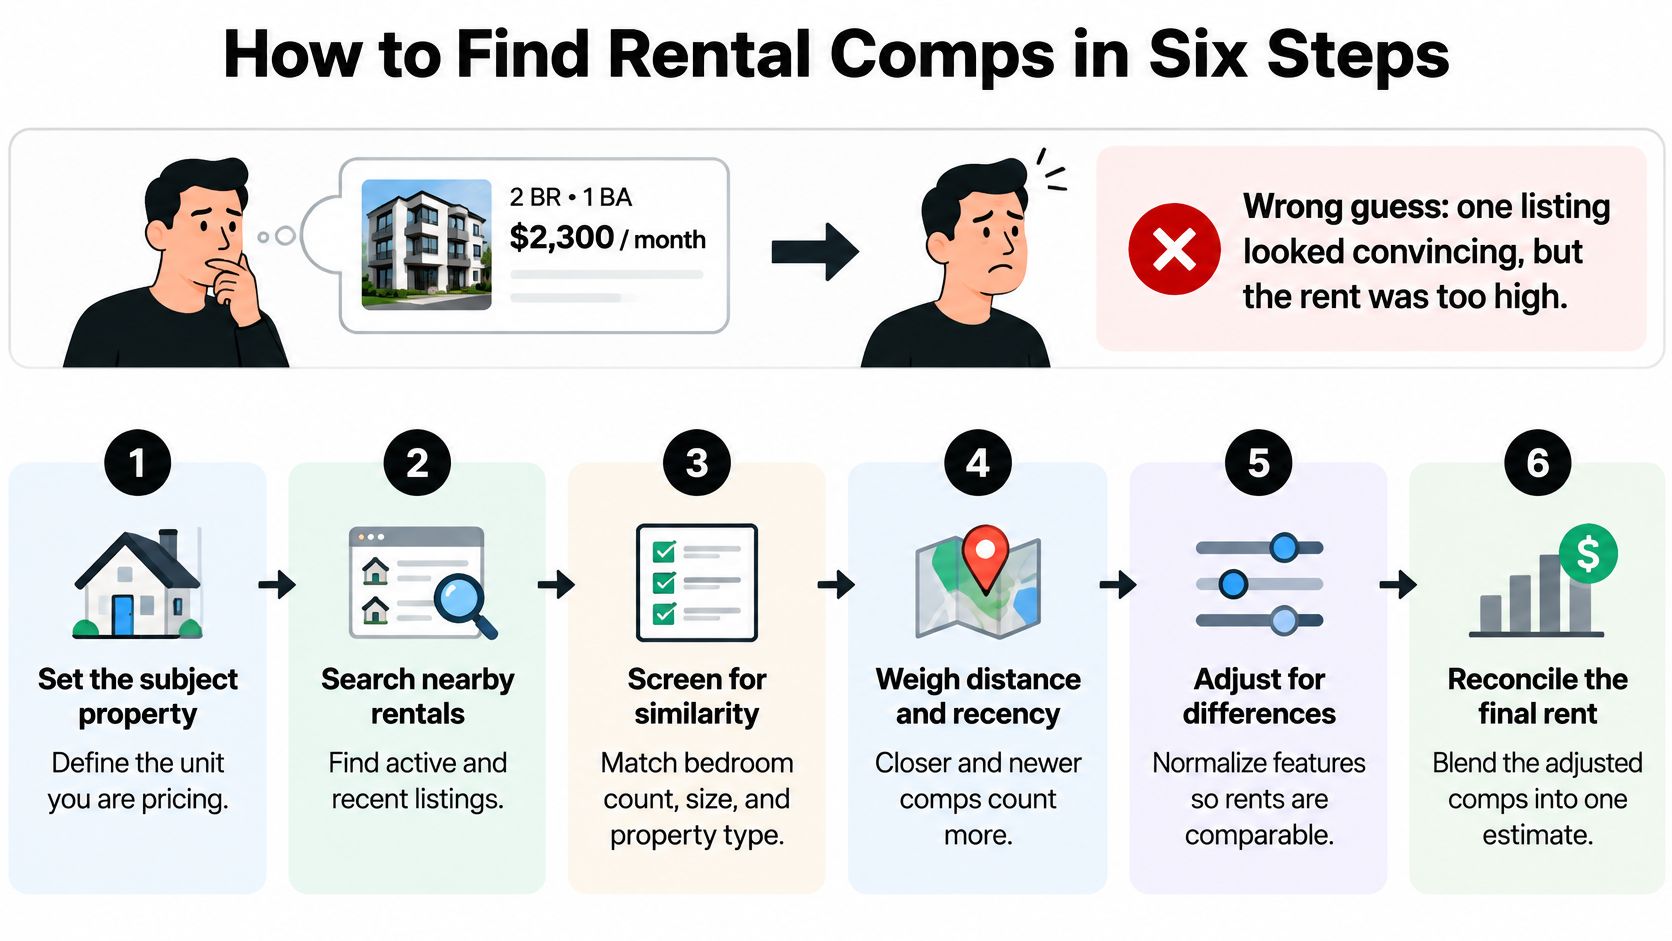
How to Find Rental Comps in Six Steps
Say an investor sees one polished listing at a high rent, copies that figure into a spreadsheet, and makes an offer. A month later, showings stall because every signed lease on the block sits well below it. One asking price told a convincing story, but it was never market rent.
Learning to find rental comps properly means replacing that guess with a repeatable workflow. I would use these six steps on every deal, in order, and keep the notes as you go.
The Six Steps
- Define the subject unit. Write down property type, unit count, bedroom and bath count, living area, year built, condition, and parking. Note which utilities the tenant pays, and whether the unit is furnished or rented short-term. If you can't describe your unit precisely, you can't judge what matches it.
- Pull a wide pool. Gather 15 to 30 listings and recent leases from the same submarket. Use roughly one mile in dense areas and two to three miles in suburbs. A wide pool matters because most candidates won't survive screening.
- Apply hard rules. Remove anything with a different property type or bedroom count. Drop units that aren't real rental options for your tenant, such as subsidized housing priced under separate rules or a luxury tower competing for a different renter entirely.
- Score for similarity. Rank what remains on distance, recency, size, and features, then keep the closest five to seven. Similarity decides the shortlist, not proximity alone.
- Verify lease dates and effective rent. For each survivor, confirm when the lease was signed and what the tenant pays after concessions. An undated asking rent is the weakest evidence you'll handle, so label it that way.
- Adjust and reconcile. Bring each comp onto your unit's basis with dollar adjustments for size, condition, and amenities. Then blend the adjusted figures into one estimate and attach a confidence level based on how tightly they cluster.
A rent figure without a confidence level is just an opinion with a dollar sign in front of it.
You finish with three things. A short, defensible comp set. A documented adjustment grid another analyst can follow. And a rent estimate you can defend to a partner or lender because every input is dated, sourced, and normalized.
Where to Pull Rental Comps and What Each Source Misses
No single source tells the whole story, so stack channels that cover each other's blind spots. Start here.
| Source | Best use | Main blind spot |
|---|---|---|
| Active listings on major portals | Current asking rents and a quick volume check | Asking rent, often before concessions; stale listings linger |
| Recently leased units from property managers | Effective rent and actual lease dates | Hard to access without relationships; small sample |
| Public records and tax assessor data | Unit size, year built and property type | Rarely includes rent, so use for physical comparability only |
| HUD Fair Market Rent and Census American Community Survey | Broad reasonableness check by bedroom count | Area-level estimate, not a property-level appraisal |
| Local landlord associations and investor networks | Off-market rents and neighborhood trends | Anecdotal; verify every figure before using it |
| Your own leasing history and portfolio | Clean lease data with real concession records | Covers only your units and your area |
| Broker or appraiser rent opinions | Expert context on unusual or hard-to-comp properties | Opinion, not evidence; ask for the named comps behind it |
What Each Channel Actually Gives You
Active listings give you volume fast. They show what landlords are asking today across the submarket, which is useful for spotting your competitive set. But asking isn't collecting, and overpriced units sit longest, so the listings easiest to find are often the ones tenants rejected.
Recently leased units are your strongest evidence. A property manager can tell you the signed rent, the lease date, and whether a free month sealed the deal. That access takes relationships, so build them before you need a number in a hurry. Pair this legwork with a structured rental property market analysis so the submarket context sits behind every comp.
Public records won't give you rent, but they'll stop you from trusting bad listing data. Confirm living area, year built, and property type against assessor records before a comp enters your set. Listing square footage is wrong often enough that skipping this check will eventually cost you.
The HUD Benchmark
Use HUD Fair Market Rent as a reasonableness check, not a comp. Under the federal Fair Market Rent rule, FMR is generally set at the 40th percentile of rents paid by recent movers into standard-quality units, and it estimates gross rent, meaning contract rent plus tenant-paid utilities. HUD relies primarily on American Community Survey data and scales other bedroom counts from a two-bedroom baseline.
That methodology teaches you three habits. Recent movers reflect current conditions better than old leases. Gross rent comparisons must account for utilities. And an area-level figure still needs adjustment for your neighborhood, condition, and unit features. If your estimate sits far from FMR for that bedroom count, you don't automatically change it, but you do owe yourself an explanation.
Log Everything the Same Way
For every candidate, record the source, capture date, and rent type, whether asking, signed, or effective. That one habit prevents the most common comp error, mixing three different kinds of numbers as if they were interchangeable.
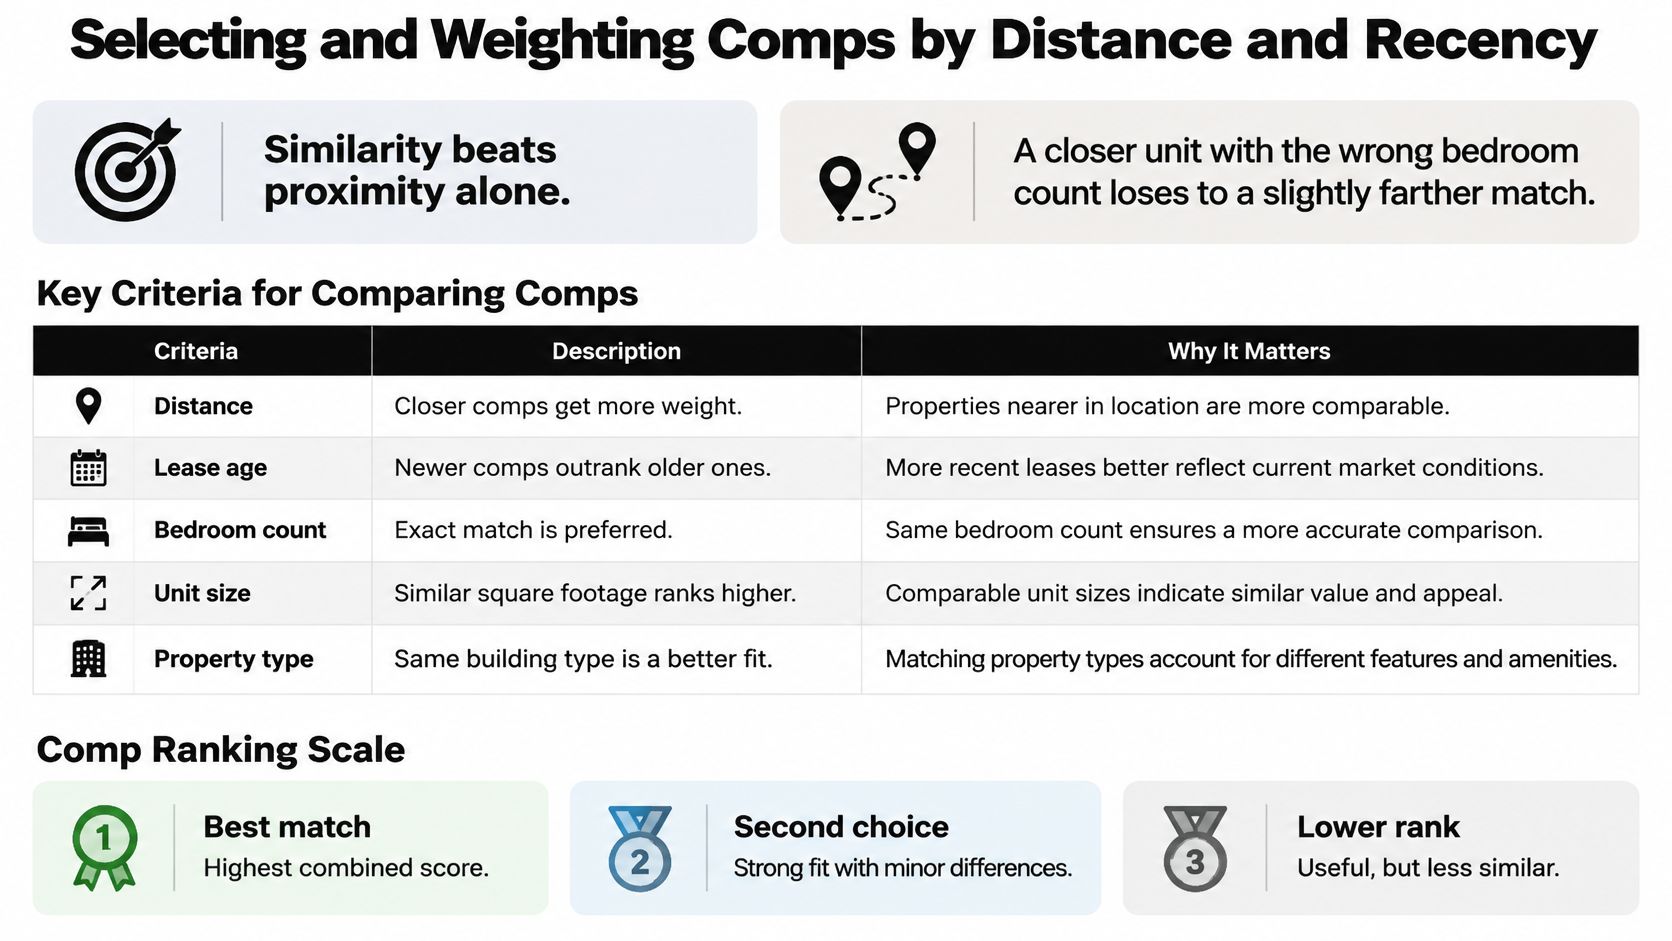
Selecting and Weighting Comps by Distance and Recency
A two-bedroom half a mile away usually beats a one-bedroom across the street. Similarity beats proximity, because a tenant weighing homes compares bedroom count, size, and features before exact distance.
Working Ranges for Each Criterion
| Criterion | Preferred match | Acceptable range | Weight |
|---|---|---|---|
| Distance | Within 0.5 mile | Up to 1 mile urban; 2 to 3 miles suburban | High |
| Lease or listing date | Last 90 days | Up to 6 months | High |
| Property type | Same type and building class | Same type only | High |
| Bedroom and bath count | Exact bedroom match | Bath within 0.5 | High |
| Living area | Within 5% of subject | Within 15% of subject | Medium |
| Year built or last renovation | Within 10 years | Within 20 years | Medium |
| Parking and in-unit laundry | Same as subject | Adjust for the difference | Low |
Recency deserves its high weight. A lease signed 90 days ago reflects the market your tenant is shopping in now. One from nine months ago may reflect a softer or firmer stretch, different concessions, and a different supply picture. Date every comp, and let older evidence carry less influence. A recent lease with two months free and an older lease at face rent are not comparable until both are on effective terms.
Distance works differently by density. In a dense core, a mile can cross into another submarket with different tenant profiles, vacancy, and concession levels. In suburbs, two or three miles may still be the same school zone and commute pattern. Judge distance by whether the same tenant would realistically consider both addresses.
How to Score and Cut the List
Score each candidate on every criterion in the table. Multiply each score by that criterion's weight, add the results, and rank the pool. Keep the top five to seven and document why the rest fell away. A shortlist of one or two lets a single odd lease drag your estimate anywhere.
Practical rule: I'd rather have five comps that need almost no adjusting than nine that each need four judgment calls.
Check regulatory status during screening too. Rent-controlled, rent-stabilized, and subsidized units follow different pricing rules. Exclude them from a market-rent set or analyze them separately, because blending them understates or overstates what an unregulated tenant pays.
When to Widen the Search
Expand the radius only into areas with a similar rent range, tenant profile, and building stock. A wider circle that pulls in a wealthier enclave doesn't fix a thin comp set. It contaminates it. Note in your file why the expanded area qualifies.
Finish by checking submarket supply. A new building in lease-up nearby can make an older property's rent look cheap when it is at market for its class. Flag new deliveries, segment your set by building class, and never let a lease-up tower set the rent for a garden-style duplex. Supply also sets concessions, so a submarket adding units can show headline rents holding while effective rents fall.
Your shortlist rule is simple. Same submarket, same bedroom count, recent date, fewest adjustments. Anything failing two of those tests doesn't belong in the final set.
Converting Asking Rent to Effective Rent
An advertised rent is a listing price. Effective rent is what the landlord collects across the lease, and in supply-heavy markets the two numbers diverge enough to break underwriting. Always convert before you compare.
This isn't a rare edge case. The Realtor.com September 2026 rent report found that in August 2026, 43.5% of rental listings across the 50 largest U.S. metros offered concessions. Nearly half the listings you'd pull are advertising a number the landlord won't fully collect.
The Conversion Math
Total what the tenant really pays over the lease term, then divide by the number of months. Say a unit advertises at $2,000 with one free month on a 12-month lease. The tenant pays 11 months, or $22,000, so effective rent is $22,000 divided by 12, about $1,833 per month.
Separate recurring from one-time incentives. A monthly discount lowers effective rent for every renewal projection you build. A waived application or move-in fee affects only year one, so don't bake it into stabilized rent.
Normalizing Utilities and Fees
If a comp includes water, trash, internet, or parking, estimate what the tenant would otherwise pay for those items. Then strip that value out when your subject's tenant pays them separately. You're comparing shelter to shelter, not shelter-plus-utilities to shelter alone.
Do the same with recurring charges like pet rent and amenity fees. Decide whether each fee is something your subject can also charge. If it can, keep it visible as other income rather than burying it in base rent. If it can't, remove it from the comp.
| Line item | Why it matters |
|---|---|
| Advertised rent | The listing price before any incentive |
| One free month on a 12-month lease | The $2,000 free month spread over 12 months |
| Effective rent | The base figure used for this comp |
| Water and trash included in comp | Removes utility value because the subject tenant pays these costs |
| Adjusted comp rent | The comparable figure on the subject's basis, before size and condition adjustments |
Walk the example through. Advertised rent is $2,000. Spreading the free month gives effective rent near $1,833. If that comp also includes water and trash your tenant would pay separately, subtract your local estimate for those services to land on the adjusted comp rent. That final line, not the $2,000 headline, is what enters your adjustment grid.
Price Your Confidence Honestly
Apply a confidence rule based on evidence type. Signed leases with dates get full weight. Advertised listings get a wider margin of error until you confirm someone leased at that figure, because the landlord may still concede more to fill the unit. If your whole set is asking rents, your estimate is a ceiling, not a conclusion.
Adjusting Comps for Size, Condition and Amenities
Start with a concrete case. Say a comp rents for $1,850 with a garage and 1,100 square feet, while your subject has 950 square feet and no garage. If local paired data values the garage at $75 and space at an assumed $0.80 per square foot, you subtract $75 plus $120 for the 150 extra square feet. The adjusted comp is about $1,655, and that figure, not $1,850, speaks to your unit's rent.
The direction matters. You always adjust the comp toward the subject, never the reverse. If the comp has a feature your unit lacks, subtract its value. If your unit has something the comp lacks, add it. Every adjusted rent should read as an estimate of what the comp would rent for if it were your property.
Where Dollar Values Should Come From
| Difference | How to measure it | Where the value comes from |
|---|---|---|
| Extra or fewer bedrooms | Compare matched pairs that differ by one bedroom | Local paired comps; test a range before settling |
| Living area | Rent per square foot from a local comp set | Slope from your comp set, not a national average |
| Garage or dedicated parking | Same-building pairs with and without parking | Local paired difference |
| In-unit laundry | Same-building pairs with and without laundry | Local paired difference |
| Renovated kitchen and baths | Compare renovated and original units side by side | Paired comps and listing photos |
| Condition | Score each comp from dated to fully renovated | Per-point value from paired comps |
| Concessions and free months | Not adjusted here; handled in effective rent | Lease records from the previous section |
Derive every value from local paired data, two listings or leases in the same building or on the same block that differ on one feature. That isolates what tenants in your submarket pay for a garage or laundry. A national rule of thumb can't do that, because a garage in a snowy city with scarce street parking isn't worth what it's worth in a suburb with driveways everywhere.
For a useful walk-through of this paired thinking applied to pricing, the Edinhart Realty and Property Management pricing guide shows how a working manager builds a rental value estimate from comparable evidence. Use it as a method check, then price your features from your own paired set.
Scoring Condition Without Guessing
Score each comp on a simple scale from dated to fully renovated, using listing photos or a walk-through. Kitchens and baths carry the most weight because tenants judge the whole unit by them. Then pull a per-point dollar value from paired renovated and original units nearby.
Watch your totals. When combined adjustments exceed roughly 10 to 15 percent of a comp's rent in your working grid, that comp is a weak match wearing a lot of math. Replace it rather than piling on more corrections.
Write one line of rationale beside each adjustment, naming the paired evidence behind the dollar figure. If another analyst can't follow your grid without you in the room, it isn't finished.
Reconciling Comps Into One Defensible Rent Estimate
Five to seven adjusted rents sit in front of you. Sort them low to high and read the shape before you touch a calculator.
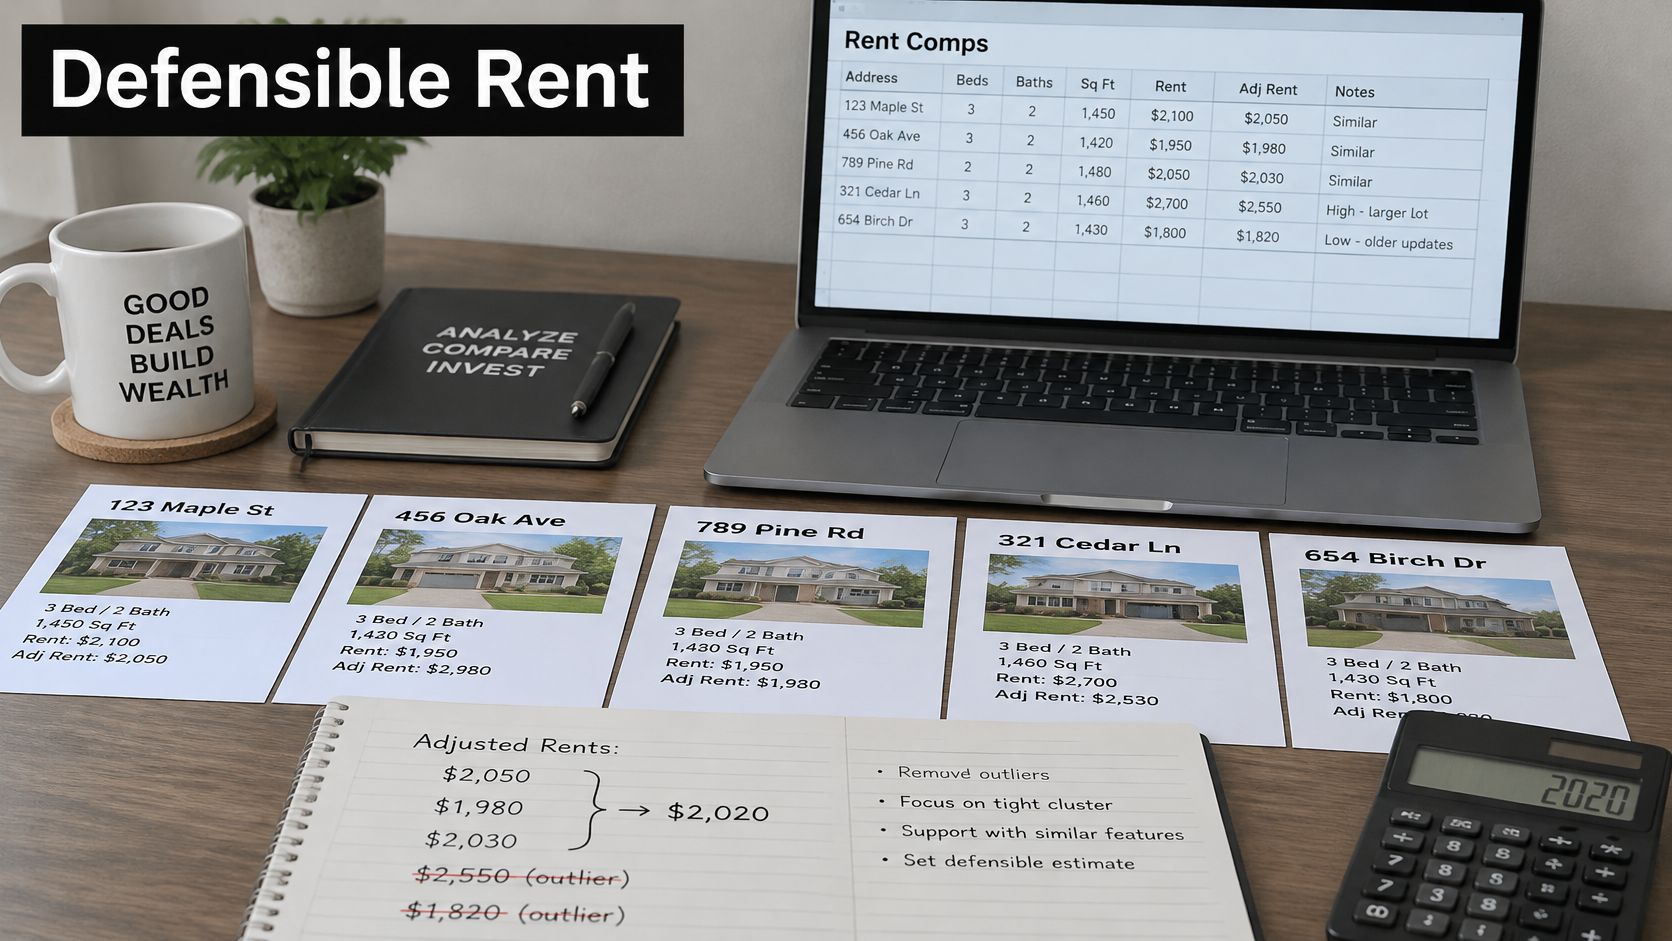
From Adjusted Rents to One Number
Drop any comp sitting far outside the main cluster, and write down the reason beside it. A dropped comp with no note has a way of creeping back into the number the next time you open the file.
Then compute a score-weighted average, giving your highest-ranked comps the most influence, and compare it with the plain median of the set. When the two land close together, the set is stable. When they diverge, one or two comps are steering the answer, and you need to know which before you trust either figure. Treat the spread itself as a confidence signal. A tight cluster supports a firm number, while a wide spread calls for another comp or a lower, more cautious figure.
Check Supply Before You Trust the Cluster
Segment by building class and lease-up status before finalizing. Falling vacancy does not reliably stop landlords from discounting, particularly near new deliveries, so a market that looks tight in aggregate can still be handing out a month free on the specific block you are pricing.
Model stabilized rent separately from lease-up rent when a nearby building is still filling. Submarkets split sharply in both directions, with new supply conceding heavily while older stock holds firm, or older stock discounting while a fresh building defends its face rent. Run the reconciliation on effective rents only, so a concession-heavy comp does not get read as a weak property when it is really a strong one carrying a temporary discount.
Sanity check your final figure against HUD Fair Market Rent for the bedroom count, then carry it into valuation. The income approach to rental valuation from VerticalRent is a handy reference for how that rent figure flows into value, and a gross rent multiplier calculator gives you a quick cross-check on price against gross rent.
Mistakes I See Repeated
- Using asking rent as market rent. Fix it by converting every comp to effective rent first.
- Mixing submarkets. Fix it by screening for tenant profile and rent range, not just distance.
- Relying on stale listings. Fix it by dating every comp and weighting recent leases highest.
- Ignoring utilities. Fix it by comparing gross rent on one consistent basis.
- Stacking too many adjustments. Fix it by replacing weak comps instead of correcting them endlessly.
- Treating one lease as a market. Fix it by holding at least three, and normally five, comps per unit type.
What comes out of this step should be one rent figure with a paper trail behind it, defensible to a lender or a partner without rerunning the whole analysis from scratch.
Confirm the Rent Estimate Before You Make an Offer
A rent estimate only matters if the deal survives it. Run the cash flow test before you write anything. The screenshot below shows the kind of comp output you should expect to interrogate, not just accept.

The Decision Rule
Build net operating income at your estimated rent, after allowances for vacancy, management, and maintenance. That figure must cover debt service plus a buffer you set in advance. No buffer, no deal, because your rent estimate is a range wearing a single number's clothes.
Then stress it. Drop the highest and lowest comp from your set and rerun the test. If the deal still clears, proceed. If it only works with your most optimistic comp included, lower the rent estimate or walk away before an offer creates pressure to believe your own spreadsheet. A full rental property financial analysis template helps you run both versions side by side.
My rule: If removing one comp kills the deal, the deal was never there. The comp was.
Use Tools to Speed Up, Not to Skip Verification
A comp tool can pull candidates for an address quickly. Our Comp Finder shows recent comparable sales for any address, and our comps are weighted by distance and recency, include adjustment breakdowns, and come with confidence scoring. Treat that output as a starting point. Confirm every rental comp shows its lease date and concession status, and verify your top comps against signed leases and public records. Users report that PropLab ARV estimates are within 3-5% of actual sale prices in most markets, but don't rely on any accuracy claim, ours included, until you've tested it against closed evidence in your own market.
The walkthrough below shows how a comp review looks in practice, so you can see what to check on screen before trusting an estimate.
Your Next Step This Week
Pick three properties in your target area. Build a comp set and adjustment grid for each using the six steps, convert every asking rent to effective rent, and reconcile to one estimate per property. Then run all three through the cash flow test, with the highest and lowest comps removed, before you submit any offer. Run the comp set and the cash flow test first. Put the offer on paper second.
Ready to put this workflow to work on a live address? PropLab pulls comparable properties with distance and recency weighting, adjustment breakdowns, and confidence scoring, so you can verify a rent estimate and test cash flow in minutes instead of hours. Paste in your next prospect, check the top comps against your own sources, and make your offer with a number you can defend.
About the Author
P
PropLab Team
Real Estate Analysis Experts
The PropLab team consists of experienced real estate investors, data scientists, and software engineers dedicated to helping investors make smarter decisions with AI-powered analysis tools.
Free tool
Pull comps for any address
Comparable sales with adjustments, ready to defend in front of a seller or a lender.
