General
Real Estate Analytics Platform: What It Is and How It Works
October 6, 2026
15 min read

A real estate analytics platform uses AI and property data to automate comparable sales, ARV estimates, and Max Offer Price calculations, helping investors evaluate deals against evidence from markets with histories reaching back to the mid-1970s and models tested on 1.2 million transactions. Its real value isn't the speed of producing a number, but showing when that number deserves confidence and when thin or stale evidence should change the offer.
You've found a house that looks like a workable fix-and-flip. The photos suggest a tired interior, the asking price leaves room for improvement, and the seller wants an answer before you've finished your coffee. The pressure isn't just to estimate the after-repair value. You need to know whether the comparable sales are genuinely similar, whether the renovation assumption is realistic, and how much risk your offer can absorb.
That's where a real estate analytics platform earns its place. The useful platforms don't replace a spreadsheet with a prettier dashboard. They collect property records, tax data, transaction histories, condition signals, and market information, then turn that material into a repeatable underwriting workflow. The strongest systems also show their assumptions, surface missing data, and make uncertainty visible instead of hiding it behind a precise-looking valuation.
Why Manual Comping No Longer Cuts It
Suppose you're underwriting a three-bedroom property in a neighborhood you know reasonably well. The manual process starts with public records, listing archives, tax information, and recent sales. You open several tabs, copy addresses into a spreadsheet, adjust for living area and condition, remove sales that don't really belong, and calculate a rough ARV. By the time the sheet looks coherent, the seller may already be reviewing another offer.
Manual analysis still has a legitimate role. Local knowledge can identify a renovated street, a flood-prone block, or a school-boundary difference that a database misses. The problem is repetition. When every property requires the same searching, copying, filtering, and arithmetic, fatigue creates inconsistent decisions. One comp gets included because it supports the target ARV, while another gets ignored because its differences are harder to adjust.

Speed helps only when the workflow stays auditable
An automated platform can search a wider evidence set, rank likely comparable properties, apply consistent weighting, and calculate a preliminary ARV without requiring an investor to re-enter the same fields. That lets an acquisitions manager reject weak leads quickly and reserve deeper inspection for properties that survive the first screen.
The trade-off is important. Automation improves consistency, but it doesn't make bad source data good. A model can process an incorrect condition record faster than a person can, and a broad data set can still miss a material property feature. The workflow therefore works best in two stages:
- Automated screening: Rank opportunities, estimate a preliminary ARV, identify obvious red flags, and calculate a provisional offer range.
- Human verification: Review the selected comps, inspect condition assumptions, confirm local context, and adjust the offer when the evidence doesn't fit.
Historical public data shows why structured processing matters. The Federal Housing Finance Agency House Price Index overview covers all 50 U.S. states and more than 400 cities, with observations extending back to the mid-1970s. An investor can't compare that breadth consistently through manual spreadsheet work alone, particularly when evaluating several markets at once.
For a practical refresher on comparing properties and documenting the evidence behind an appeal or valuation, the step-by-step tax appeal guide offers a useful reference. Investors who want a deeper look at residential comp workflows can also review residential real estate comps.
Manual comping hasn't become useless. It has become too slow and too variable as the first step for every lead. Use software to narrow the field, then apply local judgment where the decision carries financial risk.
Core Features That Drive Better Decisions
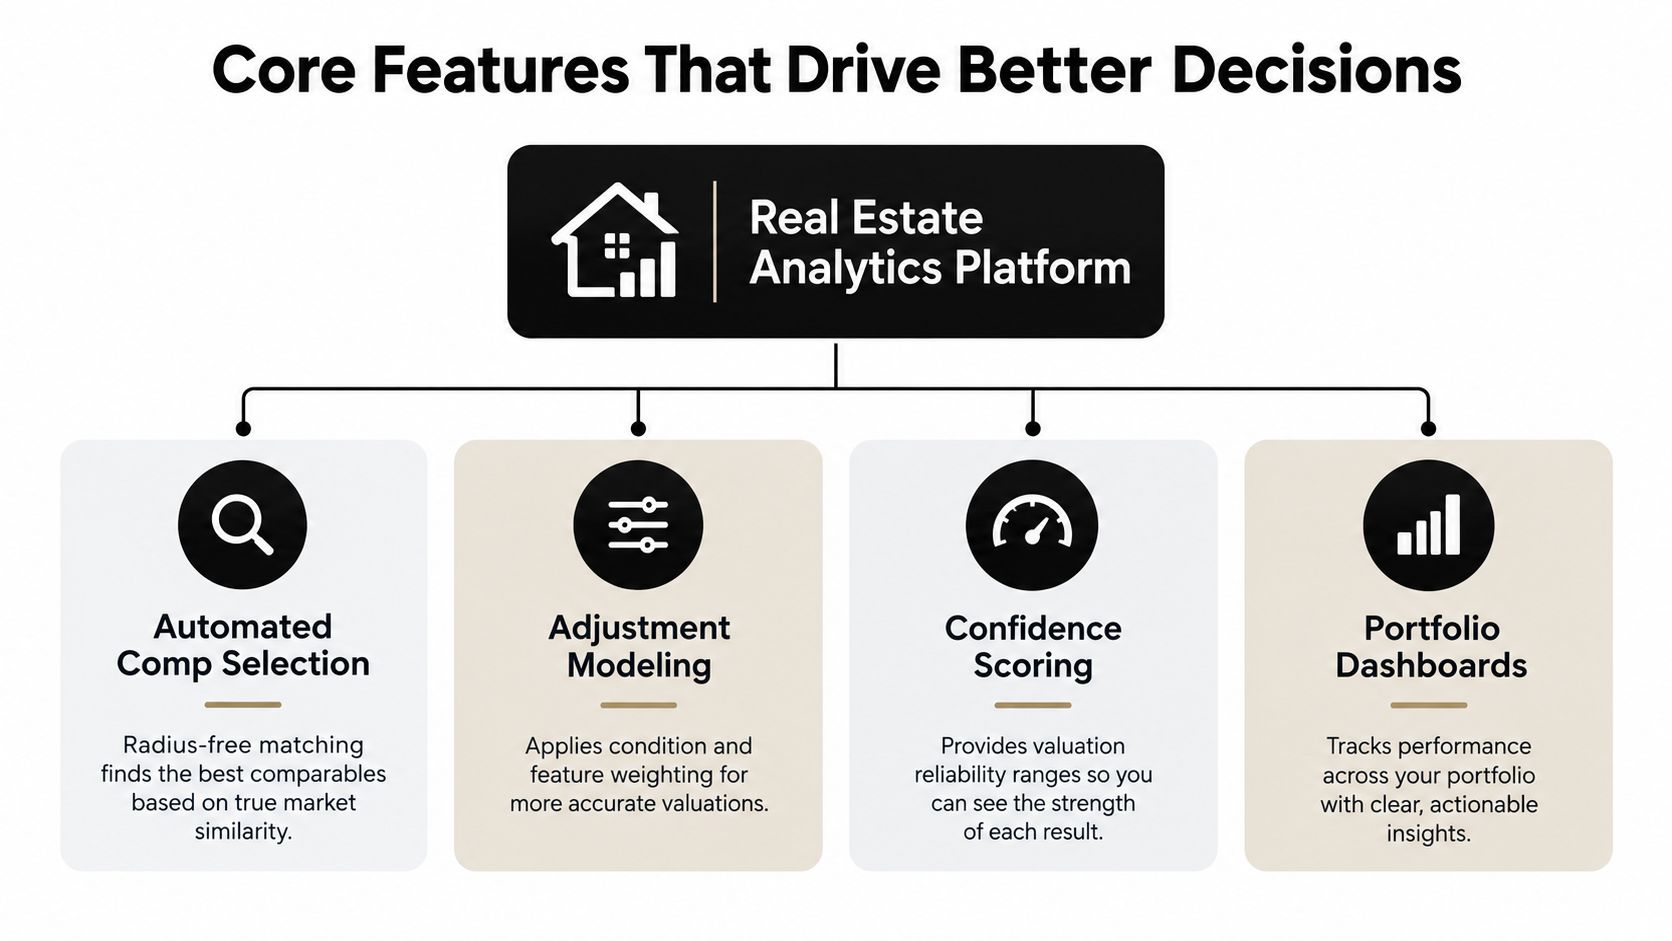
A real estate analytics platform should connect several underwriting tasks rather than present isolated calculators. The workflow starts with evidence collection, moves through valuation and repair assumptions, and ends with an offer decision that another person can inspect.
Comparable selection sets the foundation
A fixed-radius search is easy to understand, but it isn't enough for reliable underwriting. Relevant comps depend on property similarity, geographic proximity, sale recency, and local market behavior. A platform should be able to consider those factors together instead of treating every sale within an arbitrary boundary as equally useful.
Research using 1.2 million residential transactions in Germany compared ordinary least squares, generalized additive models, and XGBoost. XGBoost performed strongest overall, but the best method varied by region, which supports local calibration rather than one universal formula. The study on regional machine-learning valuation also shows why model performance needs geographic and time-separated validation.
Adjustment modeling makes the estimate explainable
A useful system doesn't only state that one property is worth more than another. It shows how differences in living area, bed and bath count, lot characteristics, age, condition, and improvements influence the comparison. The investor may disagree with an adjustment, but disagreement is productive when the assumption is visible.
Confidence scoring should describe evidence, not decorate the screen
An ARV score is useful only if the platform explains what supports it. The output should identify the comparable count, distance, sale dates, similarity, missing fields, and the resulting valuation range. A narrow range based on weak evidence is worse than a wider range that accurately reflects uncertainty.
Offer calculations convert analysis into action
Rehab estimates and ARV should flow into the Max Offer Price, alongside selling costs, financing, holding time, and the investor's required margin. The formula isn't a substitute for judgment. It creates a consistent starting point so the team can see exactly which assumption makes a deal work or fail.
Portfolio dashboards add a different layer. They help acquisition teams track analyzed properties, compare underwriting assumptions, and preserve a record of why an offer was made. Reporting and shareable links also matter when a lender or partner needs to review the same assumptions without rebuilding the model.
For a closer look at the category and its role in underwriting, property valuation software provides useful context. The practical test is simple: can a second investor reproduce the decision from the report, or does the platform ask everyone to trust an unexplained number?
Use Cases Across Investment Strategies
The same analytics platform serves different investors because each strategy assigns risk to a different part of the deal. A flipper worries about resale value and renovation scope. A buy-and-hold investor cares more about rent, operating costs, financing, and future flexibility. The software is shared, but the decision rules shouldn't be.
Fix-and-flip underwriting
Flippers need a fast first pass on ARV, repairs, holding costs, and exit margin. Automated comp selection helps identify sales that resemble the finished product rather than merely matching the current structure. Rehab estimation then turns the gap between present condition and expected finish into an explicit assumption.
The important trade-off is speed versus inspection. A quick valuation can tell you whether a lead belongs in the pipeline. It can't confirm hidden damage, permit issues, construction complexity, or a buyer preference that isn't recorded in the data. Use the platform to rank opportunities, then verify the physical assumptions before increasing the offer.
Wholesaling and acquisition work
Wholesalers often need a defensible offer quickly, followed by a buyer-friendly explanation of the spread. A report that lists the selected sales, adjustment logic, repair assumptions, and MAO is more useful than a headline number copied into a text message.
Acquisitions teams benefit from standardization. If several analysts underwrite the same market, shared criteria reduce personal interpretation at the screening stage. Managers can review outliers, compare assumptions, and identify where analysts are using different definitions of condition or resale value.
Buy-and-hold and BRRRR analysis
Rental investors need a different output from a flip investor. ARV still matters for refinance and exit planning, but projected rent, operating expenses, financing, vacancy assumptions, and capital expenditures drive the hold decision. A property can look attractive on resale value and still fail as a rental if the cash flow doesn't support the debt and ongoing costs.
BRRRR investors face both tests. They need to estimate the finished value after rehabilitation, then determine whether the stabilized property can support the intended refinance. A platform that lets users compare flip, hold, and BRRRR scenarios is more useful than one that produces only a resale estimate.
Lenders and private capital
Lenders don't need a black-box score. They need a traceable analysis that separates automated valuation, borrower assumptions, and formal appraisal requirements. A shareable report can speed review, but the lender still needs to understand the downside case and the data behind the estimate.
The breadth of AVM use reinforces this distinction. A Brookings Institution review of automated valuation models describes applications across mortgage lending, tax assessment, investment tracking, default servicing, and commercial-property valuation. That institutional reach makes transparency and risk controls more important, not less.
When to Trust Automated Valuations
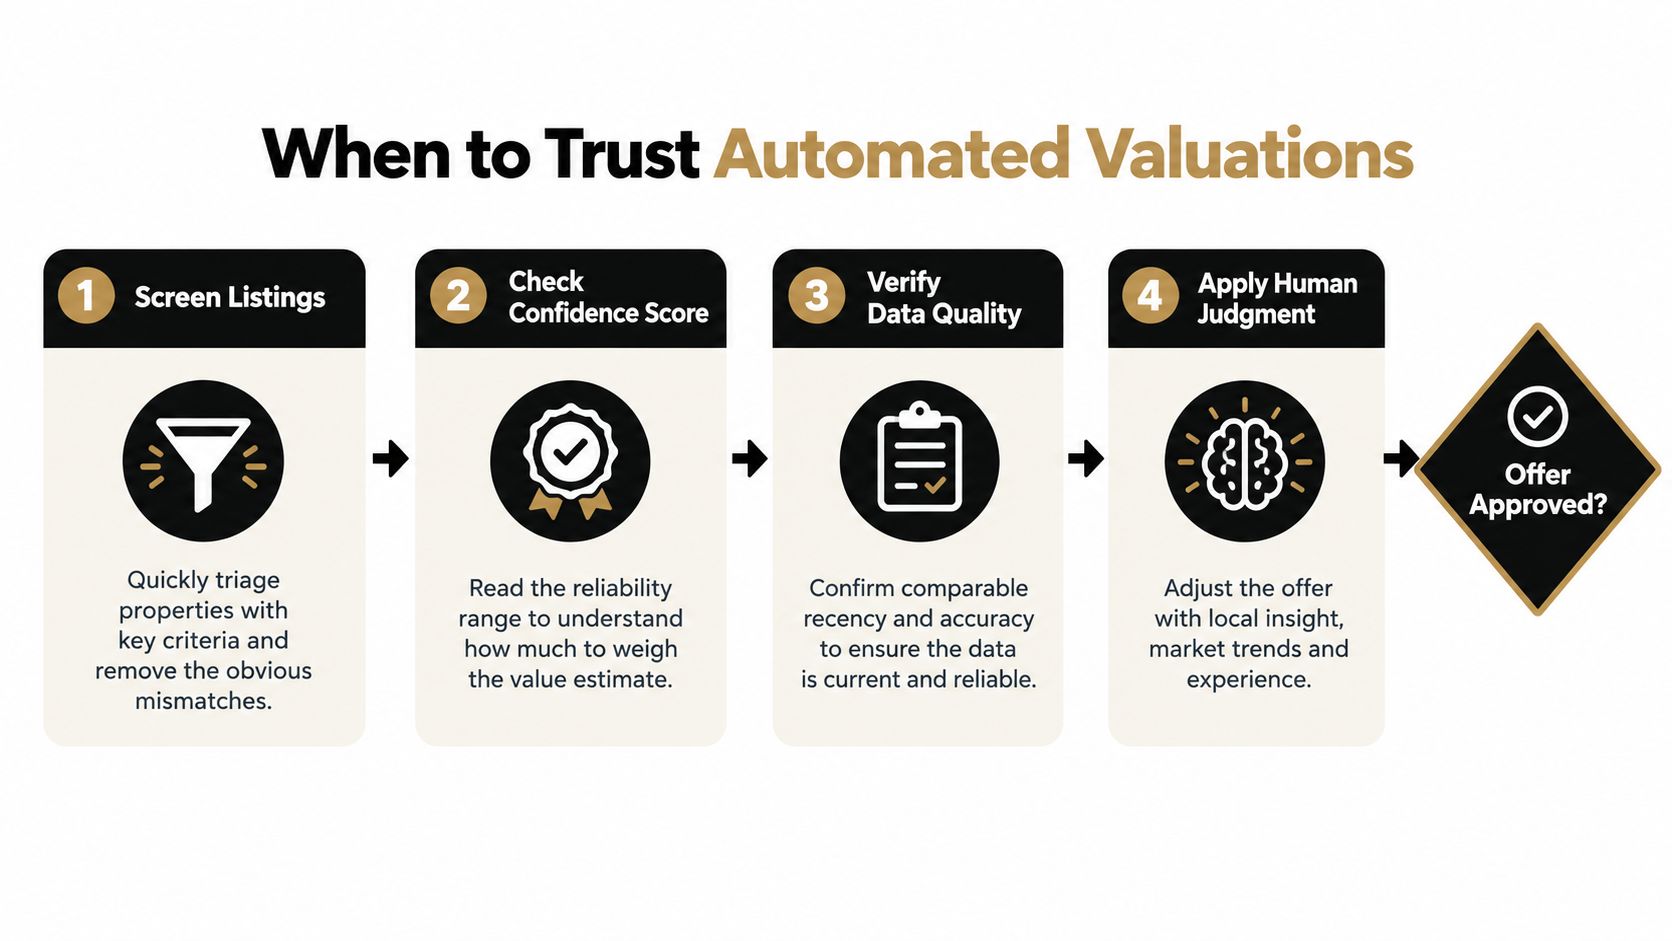
A confidence score shouldn't make you stop thinking. It should tell you how much additional work the valuation requires and how aggressively you should price the deal.
An automated valuation deserves more weight when the property is ordinary for its market, recent comparable sales are available, the condition assumption matches the sales, and the platform shows a coherent relationship between proximity and recency. It deserves less weight when the property is unique, rural, in a thin-data neighborhood, exposed to volatile pricing, or represented by stale records and outdated photos.
Use a trust protocol before changing the offer
Start by opening the comp set. Don't accept the ranking without checking whether the selected properties resemble the subject in location, layout, size, age, and finished condition. A distant but highly similar comp may be more useful than a nearby sale with a different property profile, while a recent sale may still be unsuitable if the renovation level is wrong.
Then check four items:
- Distance: Is the comp close enough to reflect the same buyer pool and neighborhood conditions?
- Recency: Does the sale represent the current market, or has the market moved since the transaction?
- Condition: Does the sale reflect the subject's proposed finished state, or are you comparing a renovated home with an average one?
- Completeness: Are tax records, sale dates, property attributes, and condition signals present and current?
If the evidence is sparse or stale, widen the ARV range and lower the maximum offer. Stress the deal with a lower resale value, higher repair cost, and longer market exposure. The platform's output should become a decision range, not a permission slip to use the most optimistic scenario.
Practical rule: Confidence should change your behavior. High confidence may support faster screening. Weak confidence should trigger more verification, a wider range, or a smaller offer.
Industry guidance commonly reports P10, the share of estimates within plus or minus 10% of a benchmark value, and emphasizes balancing geographic proximity with recency. Research also recommends presenting an uncertainty range or confidence interval rather than only a point estimate, as discussed in this AVM evaluation research.
Automated valuations are screening tools, not replacements for licensed appraisals when formal lending rules apply. Treat the model as a disciplined analyst that processes evidence quickly. You remain responsible for checking whether the evidence represents the property you intend to buy.
Climate exposure adds another reason to separate present value from total project risk. Research on flood exposure estimates that severe or extreme flood risk affects more than 6% of homes and almost $3.4 trillion in property value, while NFIP policies in force fell 4.5% year over year from May 2025 to May 2026, according to Realtor.com's climate risk analysis. The point for underwriting isn't that a hazard automatically changes comparable-sale value. Insurance costs, deductibles, resilience work, lender requirements, disaster-related vacancy, and resale liquidity may instead change the MAO and the required contingency.
Evaluating Platforms for Your Workflow
The right platform is the one that fits the decisions you already make. A feature-rich dashboard won't help if its data doesn't cover your market, its reports can't reach your partners, or its assumptions disappear when you export the analysis.
Start with the data layer. Ask whether the platform relies on public records, tax data, transaction histories, listing feeds, market signals, or a combination of sources. MLS access can be useful, but a system that works from public records and other market data may offer broader accessibility for investors who don't have MLS credentials. Coverage and freshness matter more than the label attached to the source.
Compare the outputs, not just the feature list
Run several properties you know well through each candidate. Review the comp set, not just the final ARV. Check whether the system displays adjustment logic, missing fields, valuation ranges, repair assumptions, red flags, and the calculation that produces the MAO.
A practical comparison looks like this:
| Evaluation area | Questions to ask |
|---|---|
| Data coverage | Does it cover the counties and property types you actually underwrite? |
| Comp transparency | Can you inspect distance, recency, similarity, and adjustments? |
| Uncertainty | Does the output include a range and explain why confidence changes? |
| Workflow fit | Can you export a lender-ready report or share it with a partner? |
| Integrations | Does it connect with your CRM, transaction system, accounting tools, or API workflow? |
| Support | Can someone explain a data problem when a valuation looks wrong? |
Reporting deserves more attention than many investors give it. A good report preserves the analysis at the moment the offer was made, while a live dashboard may change as new sales arrive. Teams using separate systems for analysis and transactions should also consider how data moves between them. A guide to RealEstateCRM transaction tools can help when comparing the underwriting layer with the transaction-management layer.
User experience matters in the field. If an analyst can't review a property from a phone, save the result, and send a clear report to a partner, the team will fall back to screenshots and informal messages. Before committing, test the platform with properties from different neighborhoods and condition levels, then compare outputs against your own records.
The comparison of real estate analysis tools can help organize that evaluation. Don't choose based on the longest feature page. Choose the system that makes the critical assumptions easiest to challenge.
Getting Started with Analytics Platforms
The safest way to adopt a real estate analytics platform is to start with known properties rather than live offers. Select properties where you understand the condition, neighborhood, sale history, or eventual sale price. Run the platform's analysis, compare its comp selection with yours, and record where the differences come from.
Don't judge the tool by whether it agrees with you immediately. Judge whether it explains the disagreement. A useful system may identify a comp you missed, expose an outdated assumption in your spreadsheet, or reveal that your preferred sale doesn't match the subject as closely as you thought. It should also make clear when the evidence is insufficient.
Build a repeatable review sequence
Use the same sequence for every property:
- Confirm the subject: Verify address, property type, size, bed and bath count, lot details, sale history, and known condition.
- Review the comps: Check location, recency, similarity, and the reason each sale belongs in the set.
- Test the ARV: Compare the point estimate with the range and inspect the assumptions behind the finished condition.
- Price the rehab: Separate cosmetic work from systems, structural items, permits, and resilience improvements.
- Stress the MAO: Use a lower ARV, higher repairs, longer exposure, and higher carrying costs to see whether the deal survives.
- Save the decision: Preserve the report, notes, rejected comps, and final offer so a partner or lender can follow the reasoning.
This sequence keeps automation in its strongest role, data collection, pattern recognition, calculation, and documentation. It reserves human attention for the parts that require inspection, local context, negotiation, and risk tolerance.
Measure reliability over time
Create a simple review log. For each completed deal or rejected lead, note the platform's ARV range, the comps that influenced the decision, the repair assumption, and what later information changed. Actual sale prices can help you evaluate valuation error in a holdout set, while rejected deals can reveal whether the platform consistently misses a neighborhood, property type, or condition category.
The Oslo research cited earlier provides a useful model-validation reference. A stacked model combining XGBoost, comparable-sales methodology, and least-absolute-deviation regression achieved a 5.17% median absolute percentage error on 164,619 apartment transactions, while XGBoost alone achieved 5.24%. Those figures aren't a promise for your market. They demonstrate why investors should examine median error, error percentiles, geographic separation, and time separation rather than trusting a single impressive score.
As your process matures, add integrations only when they remove a real bottleneck. API access, contract generation, portfolio tracking, and deal scanners can help an active team, but they won't fix weak comp review or unreliable condition data. The system should reduce repetitive work while making questionable assumptions harder to overlook.
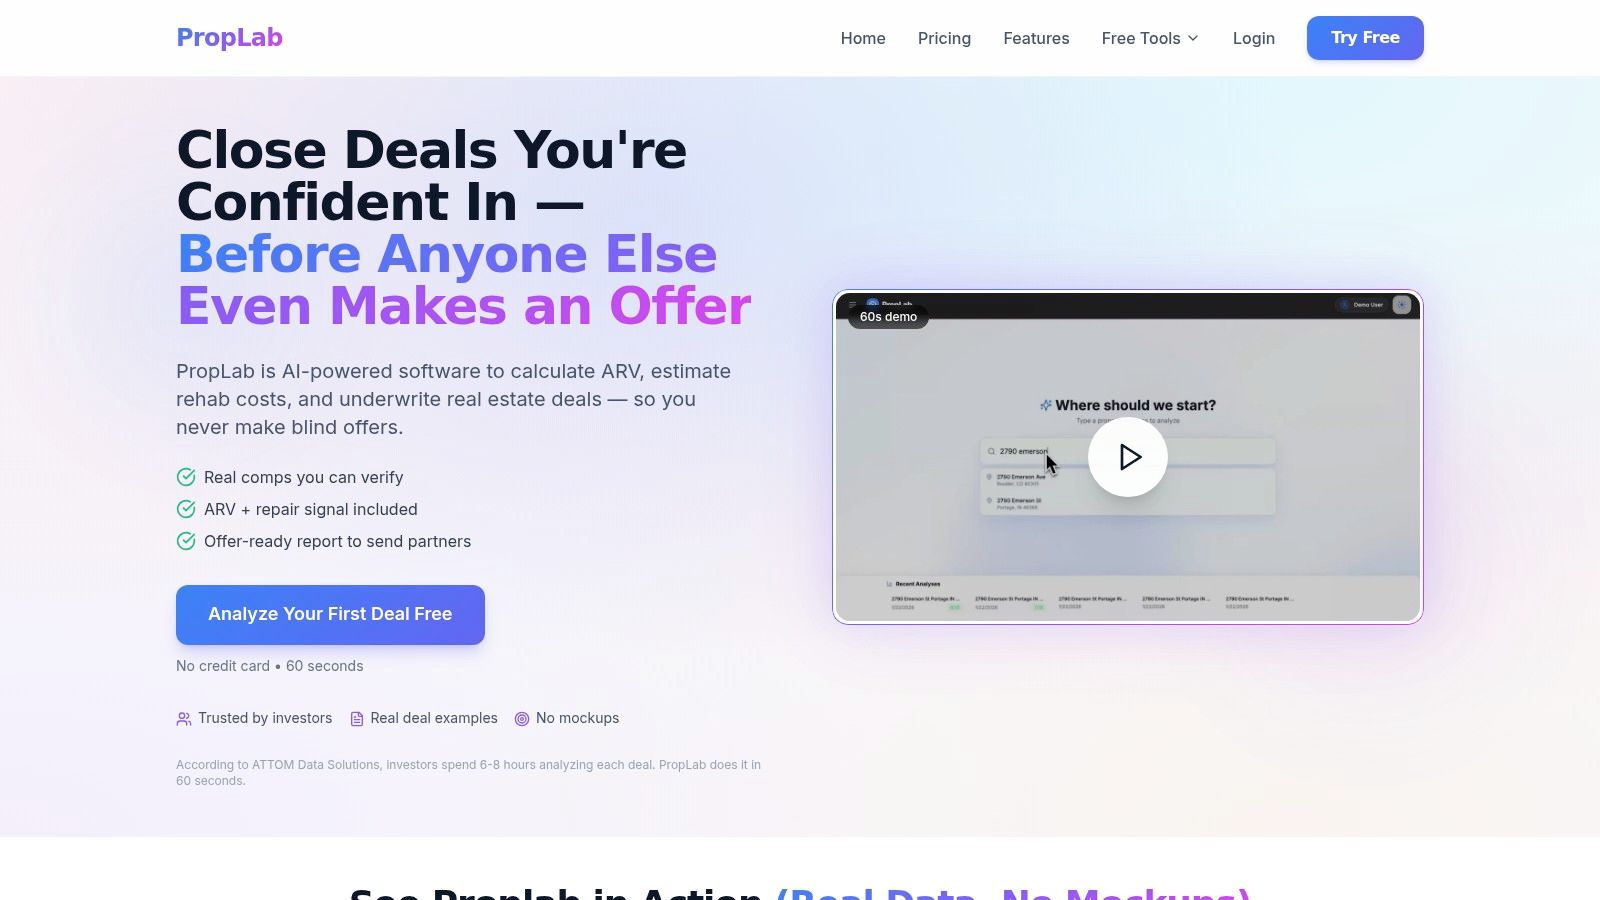
PropLab offers AI-powered underwriting for ARV, rehab estimates, comparable analysis, confidence scoring, and MAO calculations, with reports that can be shared with partners and lenders. Test the workflow on properties you already know, challenge the comp selection and uncertainty range, then visit PropLab to see whether it fits the way you evaluate deals.
Tags
About the Author
P
PropLab Team
Real Estate Analysis Experts
The PropLab team consists of experienced real estate investors, data scientists, and software engineers dedicated to helping investors make smarter decisions with AI-powered analysis tools.
Free account
Underwrite your next deal in under a minute
3 free analyses, no credit card. ARV, rehab, comps and exit strategy in one report.
