General
Public Records Property Value: A 2026 Investor Guide
November 21, 2026
15 min read

The usual advice is to look up the county's value, compare it with the asking price, and decide whether you've found a deal. That shortcut can fail before you open a calculator. The number may be a tax base rather than a market estimate, and the assessor may be describing a different house from the one you're buying.
A useful public records property value analysis starts with the record's meaning and condition, not its printed total. Audit the property card, grade the evidence, then build a sale-supported range. For a flipper or acquisitions team, the tax roll is a signal. It isn't the offer price.
What a Public Records Property Value Actually Means
The county page may show a bold total beside the parcel address, but the label matters more than the size of the number. Assessed value, taxable value, and estimated market value answer different questions. Copying any of them into an ARV field skips the work that makes an acquisition defensible.
The Lincoln Institute of Land Policy's property-tax database documents assessment structures across all 50 states and the District of Columbia, including assessment ratios, property classifications, revaluation practices, and limits on reassessments. These are local property-tax systems, not a single national valuation database. A county's published value must be interpreted under its own rules.
An assessor may begin with an estimate of market value, then apply a statutory ratio or property classification. Exemptions and caps can further change the base used to calculate tax. That means the final taxable figure may be several steps removed from the assessor's market opinion.
Identify the value before comparing it
Consider a purely hypothetical jurisdiction where assessed value equals forty percent of the assessor's market estimate. You'd divide the assessed figure by that ratio to recover the underlying estimate. In a jurisdiction assessing at full market value, that conversion would be unnecessary.
The arithmetic is straightforward; choosing the correct field isn't. Don't reverse-engineer market value until you've confirmed that the displayed figure is assessed value and that the ratio applies to the subject's property class.
What each public-record value is safe to use for
| Value on the record | What it represents | Safe investor use | Common mistake |
|---|---|---|---|
| Assessed value | Assessor figure after ratio or classification | Screening and tax math | Treating it as the resale price |
| Estimated market value | Assessor opinion of market, often lagged | Starting point before comps | Using it as after-repair value |
| Taxable value | Assessed or market value after exemptions and caps | Annual tax expense, after checking eligibility | Comparing owners across counties |
| Last sale price | Deed consideration if the transfer was arms-length | A comp only if recent and verified | Counting family, foreclosure, or nominal deeds |
| After-repair value | Your estimate of resale value in the proposed repaired condition, not an assessment field | Offer math after filtered sales and repairs | Reading it off the assessment |
Normalize the record before using it
Keep the valuation date separate from the date you downloaded the page. A current website can display a value based on an older assessment cycle. Likewise, an updated owner name doesn't establish that the assessor inspected the building or refreshed its condition.
Before comparing counties, write down the assessment ratio, property class, and last revaluation year. Record the value label beside the amount rather than saving an unlabeled total in your spreadsheet.
Practical rule: If you can't explain how the county arrived at the displayed field, don't use it to rank acquisition opportunities.
Audit the Card Before You Trust the Number
A strong pricing model can't rescue the wrong building description. The Cook County Assessor's discussion of better home data identifies incorrect property descriptions as grounds for appeal. For a buyer, that same defect is a reason to question the valuation input before negotiating.
Use this workflow as a document checklist, not permission to derive a resale price from the tax bill alone.
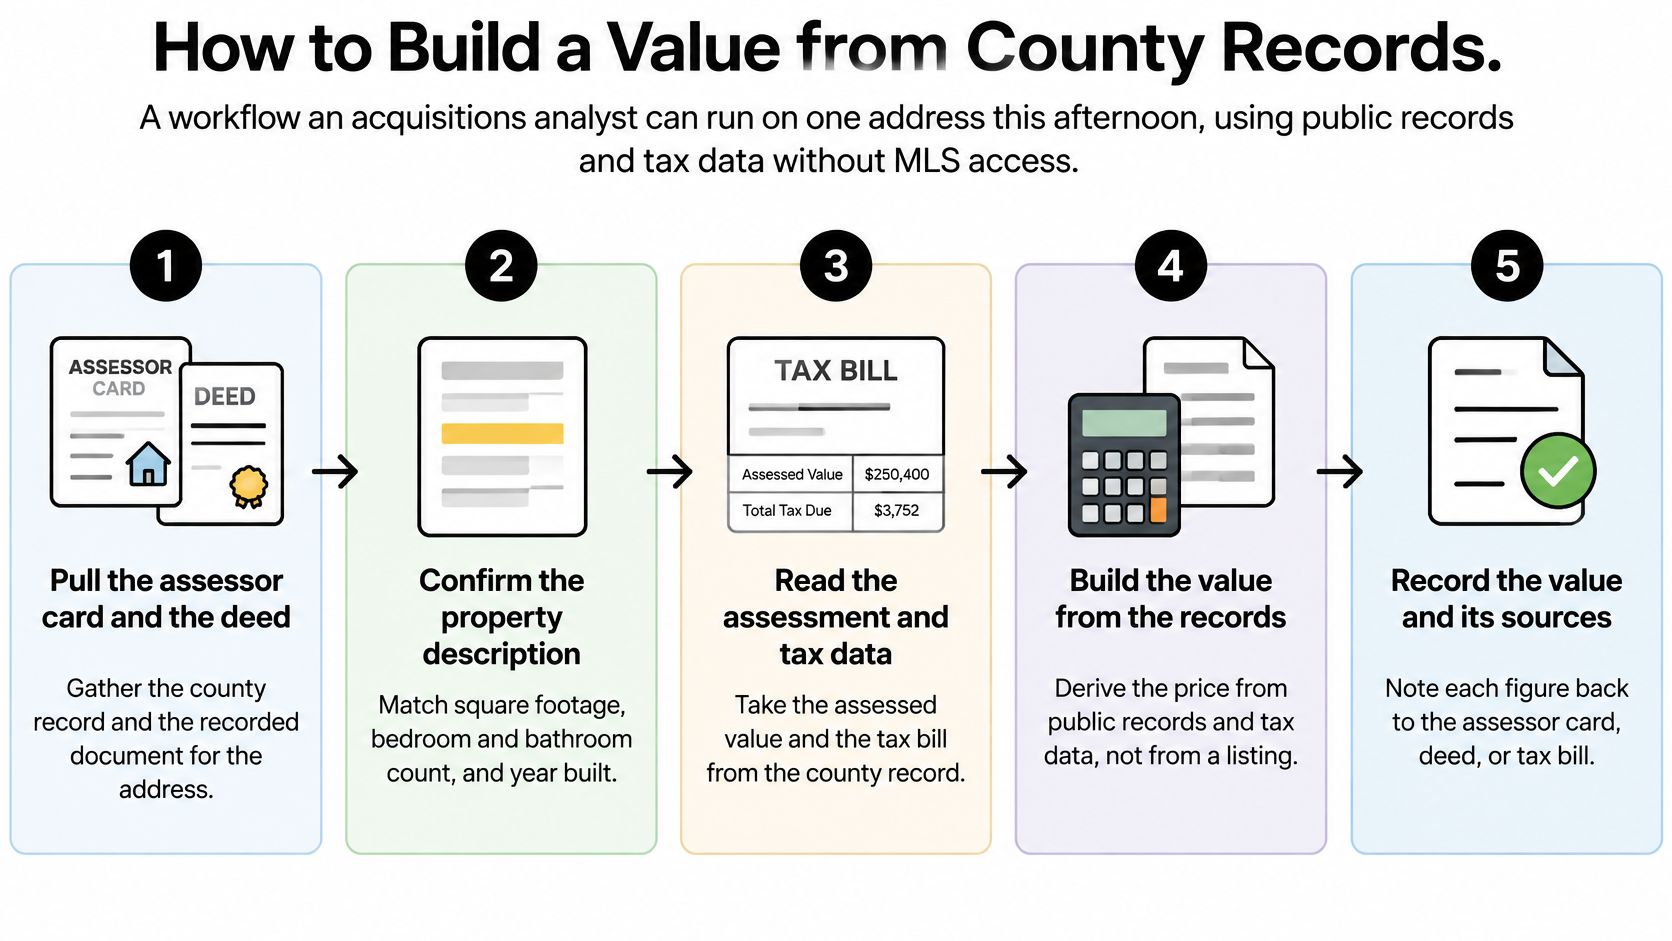
Check the description in a fixed order
- Reconcile building area. Compare the assessor card with available plans, a survey showing improvements, prior listings, and field measurements. Separate finished living area from garages, unfinished basements, and accessory structures. A disagreement is an investigation item, not an invitation to select the largest figure.
- Read the permit chronology. Look for additions, conversions, demolition, and completed work that never reached the card. An issued permit doesn't establish that construction was completed.
- Separate land and improvements. Keep both components visible so you can identify which assumption needs correction. Don't fix an implausible land allocation by adjusting the whole property indiscriminately.
- Confirm classification and condition. Check use, building type, and any recorded condition category. A residential label doesn't tell you whether the interior matches your proposed resale finish.
- Date the meaningful update. Distinguish an ownership update from a physical-property update. Flag descriptions that predate substantial changes to the house or surrounding sale market.
Over-smoothing is another reason an unusual property deserves scrutiny. When comparable sales are scarce, mass-appraisal methods can pull an atypical home toward neighborhood averages; cost-based approaches can also substitute replacement-cost estimates for direct market evidence. Don't correct either problem with an automatic uplift.
Keep parcel classes separate
The Federal Housing Finance Agency's Maricopa County study found that, using land sales and parcel records from 2012 through 2018, estimated land values for developed parcels averaged 14% higher when inferred from vacant-land transactions because of plattage effects and other unobserved factors. That finding is a warning about mismatched parcel classes, not a universal deduction.
Classify the subject as vacant, improved, subdividable, or already platted before choosing a land rate. Match zoning, frontage, access, lot shape, and development rights. If the land estimate relies on incompatible vacant sales, replace or substantiate that evidence before it affects the offer.
Use the video as a companion to the written checks, while keeping your source documents attached to the file.
Finish with a card-quality note: complete and current, usable with a confidence discount, or unsuitable for underwriting. A confidence discount means less reliance and a more conservative ceiling, not an invented percentage haircut.
How to Build a Value from County Records
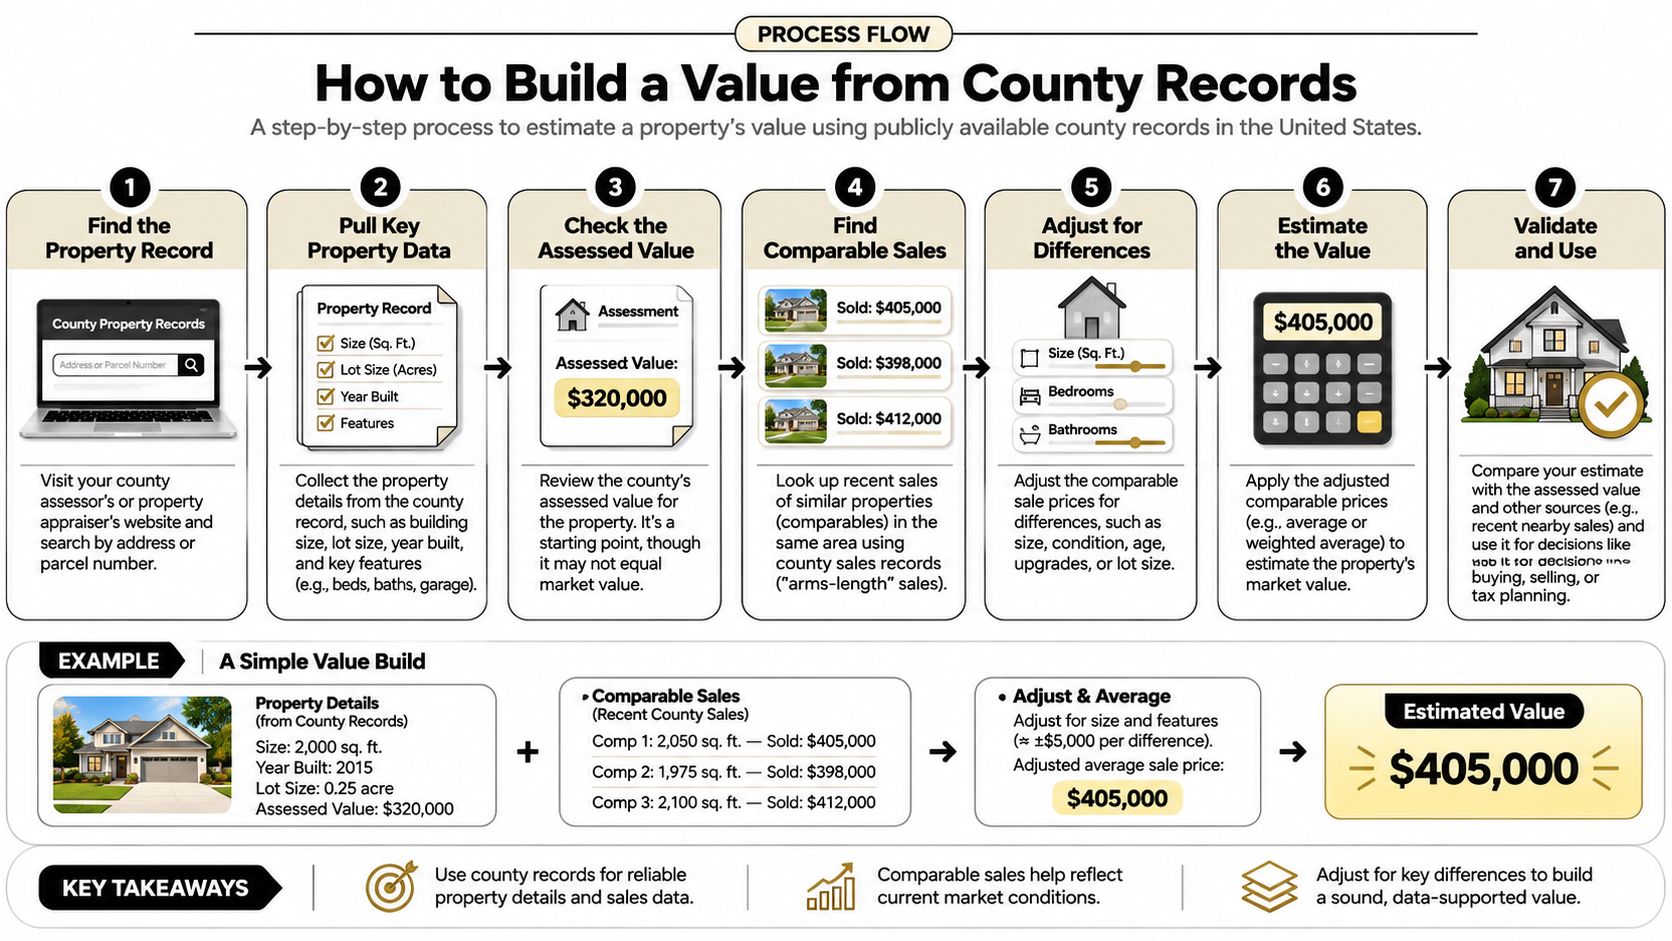
You can build a useful comparable-sale file without MLS access, but you can't skip verification. The International Association of Assessing Officers' mass-appraisal guidance describes ratio studies as comparisons between appraisals and market-value indicators such as verified sales, with each assessment-to-sale ratio calculated as assessed value divided by sale price. The quality and representativeness of the sample matter more than its raw size.
At PropLab, we pull property data from public records, tax assessments, and market data, and users don't need MLS access. Regardless of how you collect the records, keep the underlying documents available for review.
Build a traceable sale file
Join the assessor card, deed, and tax bill on parcel ID. Use the parcel identifier as the primary key, then reconcile the site address, owner, and legal description. When identifiers differ, investigate parcel splits, combinations, or formatting differences rather than forcing a match.
Exclude transfers that don't represent ordinary market transactions. Set aside family deeds, nominal-consideration transfers, foreclosure conveyances, and partial-interest sales. Preserve the exclusion reason in a separate column so another analyst can reproduce your selection.
Verify the property and transaction. Check the sale date, living area, bedrooms, bathrooms, lot characteristics, and transaction conditions. A deed establishes a recorded transfer, but it may not explain the property's condition or whether the consideration covers additional parcels. This guide to public records of house sales helps distinguish the sale trail from a usable comparable.
Stratify before calculating. Group candidates by neighborhood, property type, and price band, then prioritize relevant location and recency. Don't mix a renovated resale with a dated property just because they share a postal code. Expand the search only when you can explain what changed and why the replacement evidence remains useful.
Report the range and diagnostics. Include the filtered median sale price, median assessment-to-sale ratio, weighted mean ratio where appropriate, dispersion, and outlier count. The median is less sensitive to extreme observations than the arithmetic mean, but neither makes an unrepresentative sample reliable.
The visual provides a companion checklist for keeping each document connected to the final analysis.
Keep the diagnostics in their proper role
The assessment-to-sale ratio is a consistency check, not an ARV multiplier. An unusual ratio should send you back to the transaction, assessment date, classification, and property description. It shouldn't trigger an automatic adjustment to the subject.
For a rental fallback in New York City, you can check New York City rental prices through RentReboot to test the rent assumption separately. Rental evidence supports the alternative operating case; it doesn't establish the renovated sale price.
Reduce confidence when the surviving records are stale, geographically mismatched, sparse, or insufficiently verified. Your deliverable is a filtered comp range with an evidence trail, not a precise-looking restatement of the assessor's number.
Tax Rates and Assessment Bias That Skew the Roll
Similar assessed values don't establish similar market prices or carrying costs. The Lincoln Institute of Land Policy's property-tax resources report widespread vertical inequity, with lower-priced properties often assessed at a higher percentage of market value than higher-priced properties, and effective tax rates for a median-value owner-occupied home ranging from 0.3% in Hawaii to 2.2% in New Jersey. That is a 1.9-percentage-point spread, with the New Jersey rate more than seven times Hawaii's.
Effective tax rate means the tax bill divided by market value. It's useful for comparing burdens, but it isn't necessarily the nominal rate you apply to the county's taxable base. Mixing those denominators produces an expense forecast that looks rigorous and is wrong.
Read the pattern before screening the deal
How the roll distorts price and tax cost
| Pattern | What the record shows | Investor move |
|---|---|---|
| Hawaii effective rate | About 0.3% of market value on a median-value owner-occupied home | Don't read a low bill as a low price |
| New Jersey effective rate | About 2.2% for the same measure, more than seven times Hawaii | Stress-test tax expense and holding-period cash needs |
| Lower-priced homes | Often assessed at a higher percentage of market value | Don't rank deals by assessed value alone |
| Higher-priced homes | Often assessed at a lower percentage of market value | Check proportional understatement rather than assuming a bargain |
| Stale revaluation or cap | Taxable value can lag the current sale market | Check revaluation timing, exemption eligibility, and cap rules |
These state-level effective rates describe a particular owner-occupied housing measure. They aren't parcel-level tax quotes for investment properties. Use them to recognize the scale of geographic differences, then obtain the subject's actual taxing-jurisdiction information.
For a flip, the tax forecast belongs beside financing, insurance, utilities, and other holding expenses. A project with a slower renovation schedule needs a different carrying-cost allowance even when its expected resale price stays unchanged.
Underwrite the buyer's tax position
Check the local assessment ratio, revaluation cycle, exemptions, nominal rate, and applicable limits before carrying forward the seller's bill. Ask the assessor or tax office how the contemplated ownership and use affect the calculation. Don't assume an owner-specific exemption survives the purchase.
A cap or delayed revaluation can make the historic bill a poor forecast after a change in ownership or later reassessment. Keep the current bill and your projected expense in separate spreadsheet fields, with the reason for any difference documented. The distinction between appraisal and assessment also matters when someone presents a tax figure as support for the purchase price.
For acquisitions spanning countries, separate recurring property tax from transaction taxes. REISR's guide to purchase tax rates in Israel is a relevant starting point for that separate purchase-cost question, not a substitute for a local recurring-tax forecast.
The same recorded property value is neither proof of the same annual tax nor proof that the homes are worth the same amount.
Deals Where the Public Record Is a Weak Signal
I would widen the valuation range or pause underwriting when two or more unresolved low-confidence flags appear. That's a screening rule, not a statistical threshold. Its purpose is to stop the team from turning several unknowns into one confident-looking number.
Public availability doesn't make an assessment neutral. Governing's examination of property-taxpayer concerns discusses how assessment errors and appeal outcomes can differ by race, income, neighborhood, and turnover, including wealthier owners' greater likelihood of challenging assessments and obtaining reductions. A value that remains on the roll hasn't necessarily survived an equally accessible correction process.
Grade the evidence, not the neighborhood
Confidence should reflect transaction quality, property-description completeness, and the availability of relevant comparisons. Don't assign an individual property a discount because of its residents' demographics. Use gaps in the evidence to trigger additional verification rather than to presume a lower price.
Confidence flags for a public-record value
| Record situation | Confidence | Why |
|---|---|---|
| Frequent arms-length sales and complete characteristics | High | The sample represents the market |
| Off-market, nominal, or distressed transfers | Low until verified | The price may not represent an ordinary market transaction |
| Missing permits or a recent renovation | Low | Current condition may be invisible on the roll |
| Nondisclosure state or thin turnover | Low | Verified sale prices may be unavailable |
| Unusual home in a sparse comp set | Medium | The available comparisons may not capture its distinguishing features |
| Lower-income area with few appeals | Medium to low pending verification | Assessment errors may remain uncorrected |
An off-market sale isn't automatically unusable. Verify exposure, buyer-seller relationships, consideration, and condition before deciding whether it belongs in the sample. A distressed transfer also needs more context than its recorded price alone supplies.
Recently renovated houses deserve particular caution even in otherwise active neighborhoods. The public record may describe the pre-renovation property while a seller's photographs show the proposed comp condition. Verify the completed scope rather than assuming either source tells the whole story.
Resolve the missing information directly
Where sale prices aren't publicly disclosed, don't treat blank consideration fields as evidence of a quiet market. Seek lawful transaction verification through available documents and counterparties, and distinguish verified consideration from a listing or asking price.
Neighborhood context can help explain why parcel-only comparisons miss relevant differences. Review boundaries, access, surrounding uses, and the consistency of the chosen comparison area without substituting demographic assumptions for property evidence.
Decision test: Name the missing fact and the document or inspection that could resolve it. If neither can be identified, the uncertainty belongs in the acquisition decision.
A wider range is appropriate when additional evidence could reasonably change the result. Passing is appropriate when the unresolved issue can erase the margin and you can't verify it before committing.
Set the Offer from the Cleaned Value Range
Start the offer analysis with the filtered median sale, then reconcile the subject's differences and intended resale condition. The median is an anchor, not the final ARV. Your written range should explain which completed improvements and comparable properties support its upper end.
If the card-quality note is usable with a confidence discount, lower the acquisition ceiling before treating the project as ready to approve. Don't hide uncertainty inside the repair budget. Keep the evidence allowance separate so a partner can distinguish construction risk from valuation risk.
Translate resale evidence into an acquisition ceiling
Use a complete cost bridge rather than subtracting rehab alone:
Maximum offer = supported resale value − repairs − financing and holding costs − transaction costs − target profit − unresolved-risk allowance
The maximum allowable offer framework provides a way to organize those inputs. The calculation is only useful when every deduction has a defensible basis and you haven't counted the same contingency twice.
- Document repairs. Build the scope from a site visit, permit history, and contractor pricing. Separate necessary work from optional upgrades that your chosen comps don't support.
- Investigate concealed damage. FullScope Pest Control's guidance on termite inspection reports before closing is relevant when wood-destroying-insect concerns could change the repair scope. Don't bury an unresolved structural exposure in a cosmetic allowance.
- Model the actual hold. Apply the projected tax expense to the anticipated ownership period and carry financing, insurance, utilities, and maintenance alongside it.
- Protect the exit margin. Test a conservative resale outcome and a delayed sale. If either eliminates the required profit, reduce the offer or decline the deal.
Write the conditions beside the number
A developed parcel supported only by unsuitable vacant-land comparisons needs better land evidence, not a borrowed universal haircut. An unresolved description error needs verification, not a more elaborate spreadsheet. State what must be confirmed before the acquisition ceiling becomes actionable.
Label the output an investor value range. AI-generated ARV calculations and valuations aren't licensed appraisals, definitive valuations, or guaranteed forecasts, and not all underlying third-party data has been independently verified.
Put the offer range, assessment ratio, last revaluation year, card-quality grade, and outstanding conditions on the same decision sheet. Your team should be able to see both the proposed price and the reason you're willing to pay it.
PropLab combines public records, tax assessments, and market data to support comparable-sale analysis without requiring MLS access. Visit PropLab, paste a target address or an MLS, Zillow, or Redfin link, and use the resulting analysis alongside your card audit to build a documented offer range.
About the Author
P
PropLab Team
Real Estate Analysis Experts
The PropLab team consists of experienced real estate investors, data scientists, and software engineers dedicated to helping investors make smarter decisions with AI-powered analysis tools.
Free tool
Pull comps for any address
Comparable sales with adjustments, ready to defend in front of a seller or a lender.
